


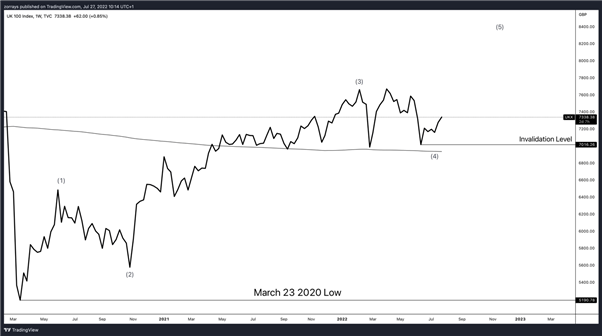
The FTSE 100 has been on a bullish run since March 2020 low. It appreciated nearly 57% since the Covid-19 pandemic. A further appreciation is still in play based on the Elliott Wave count it has formed since 2020.
July 27 2022 – Weekly Timeframe
Source: TradingView prepared by Zorrays Junaid
According to the weekly timeframe chart, the FTSE 100 is unfolding a 5-wave sequence to the upside. Alongside my count, you can see that wave (3) breached through the 200 day Moving Average and has remained above it as wave (4) unravels.
Wave (2) unfolded as a Zig Zag and based on the guidelines of alternation we can see that wave (4) has developed a Contracting Triangle formation. An Elliott Wave Theory based Contracting Triangle is a sideways correction which indicates the market is flat, but it is building up the next outburst within the overall trend. Triangles strictly show up prior to a final push into the overall trend, therefore, a rotation is expected once wave (5) is over – I will be updating this progression in the future.
July 27 2022 – 4H Timeframe
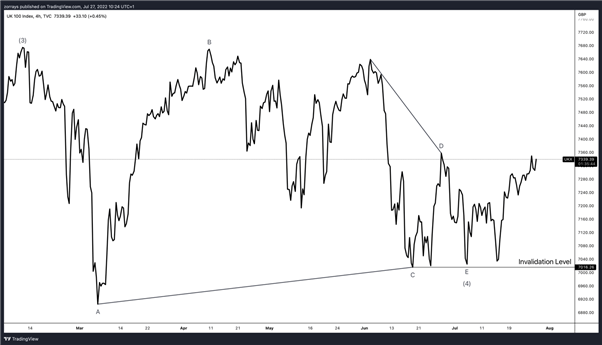
Taking a closer look at this triangle – it has complied with the rules correctly. It unfolded in a 5-wave contracting sequence labelled as ABCDE. More importantly, wave C did not exceed the extreme of wave A, wave D did not exceed the extreme of wave B. Finally wave E did not exceed through the invalidation level which is the extreme of wave C.
The next move expected on the cards would be a 5-wave sequence labelled 12345 favouring wave (5) to the upside. This move can take up to a couple of weeks to a month to complete. The first pit stop to see is the break of wave D and then the break of the highs at 7676.
Invalidation Level
If price decides to break through the extreme of wave C at 7016. There is a good chance that the FTSE 100 has returned to wave (4) or this whole move was a 3-wave sequence to the upside, therefore a corrective move. If that is the case, the FTSE 100 can expect to correct deeper into March 2020 lows.


