


AUD/USD TALKING POINTS
AUSTRALIAN DOLLAR FUNDAMENTAL BACKDROP
The Australian dollar is finding some bids after a slow start to the Asian trading session as recessionary fears are receding along with a boost from Chinese industrial data earlier this morning. While the data showed declining profits both YTD and YoY for the month of May (see calendar below), the level of slowing has decreased significantly from the April print thus showing some signs of positivity withing the industrial landscape. With China having such close trade ties with Australia, the high correlation between the two has filtered through to the AUD/USD currency pair. Spot gold and iron ore have supplemented these Aussie gains with both metals marginally higher.
AUD/USD ECONOMIC CALENDAR
The economic calendar is relatively light today with U.S. durable goods orders likely to have some U.S. dollar influence and is expected to come in lower than the prior figure. If this is accurate, we could see an extended AUD push higher.
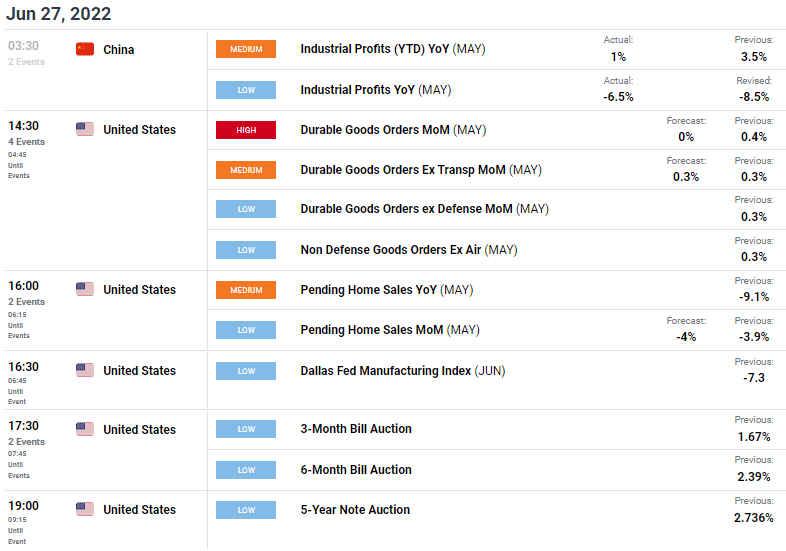
Source: DailyFX economic calendar
AUD/USD TECHNICAL ANALYSIS
AUD/USD DAILY CHART
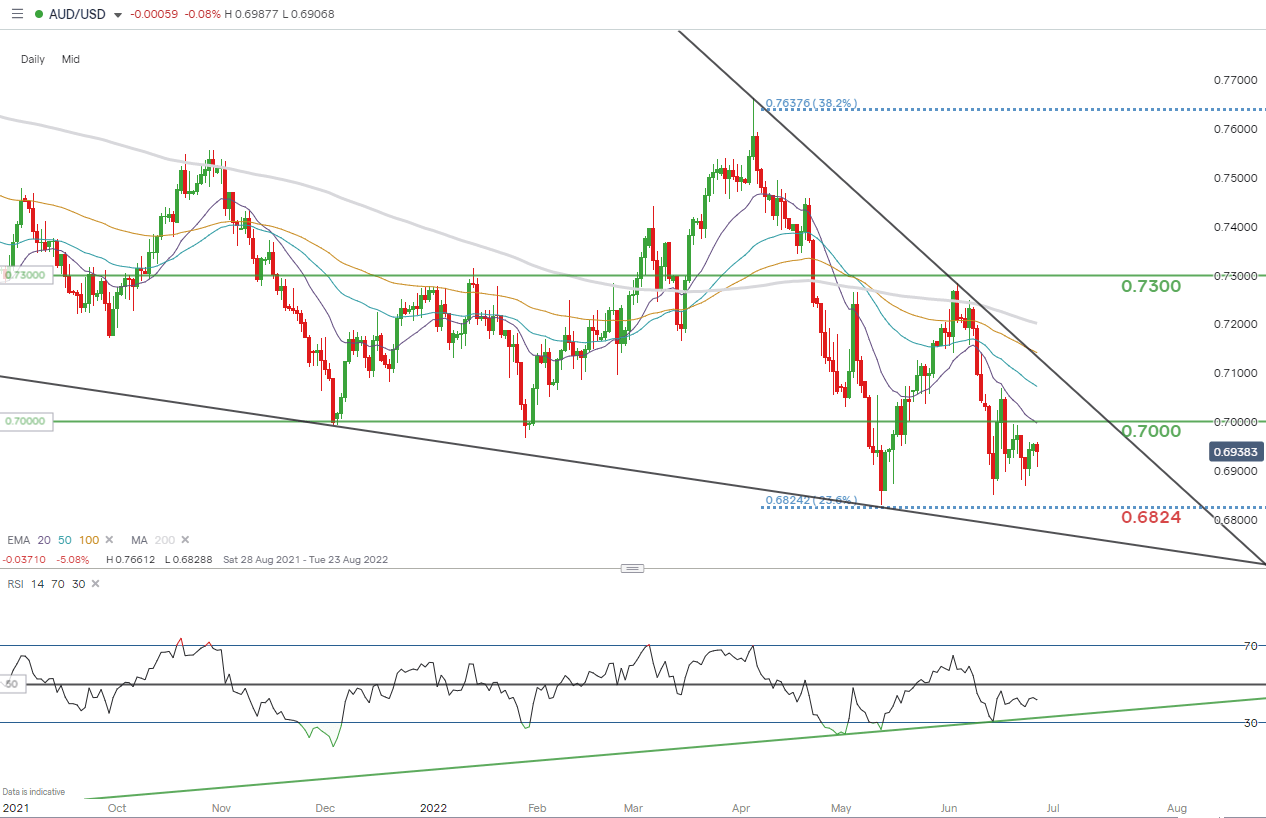
Chart prepared by Warren Venketas, IG
Daily AUD/USD price action showing lower long wick candles which are traditionally indicative of a bullish bias. The Relative Strength Index (RSI) augments this viewpoint (green) as we can see slowing downside momentum which should bring the 0.7000 psychological resistance zone into consideration short-term.
Key resistance levels:
- 20-day EMA (purple)/0.7000
Key support levels:
- 0.6824
IG CLIENT SENTIMENT DATA: BULLISH
IGCS shows retail traders are currently LONG on AUD/USD, with 71% of traders currently holding long positions (as of this writing). At DailyFX we typically take a contrarian view to crowd sentiment however, recent changes in long and short positioning results in a short-term upside bias.
| Change in | Longs | Shorts | OI |
| Daily | 2% | 3% | 2% |
| Weekly | 29% | -46% | 0% |
Contact and follow Warren on Twitter: @WVenketas


