


USD/JPY News and Analysis
- Mass JGB Bond Sell-off Tests BoJ’s Resolve
- USD/JPY looking to levels not seen in 24 years if current bull run continues
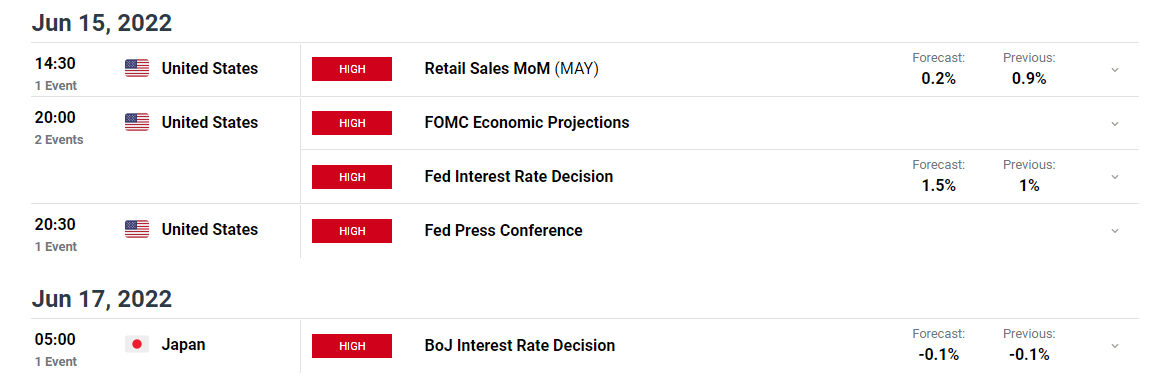
- FOMC, US retail sales, and the BoJ meeting likely to usher in volatility
Mass JGB Bond Sell-off Tests BoJ’s Resolve
Early on Tuesday, the Bank of Japan (BoJ) expanded bond buying and offered to increase purchases over different durations on Wednesday, to bring the yield on the 10-year Japanese government bond (JGB) back within the 0.25% cap.
This comes in response to a massive spike which saw the yield rise as high as 0.337% as the Bank attempts to keep rates ultra-low in support of the local economy despite a wave of rising global rates.
Chart: Japanese Government Bond (10 Year Yield)
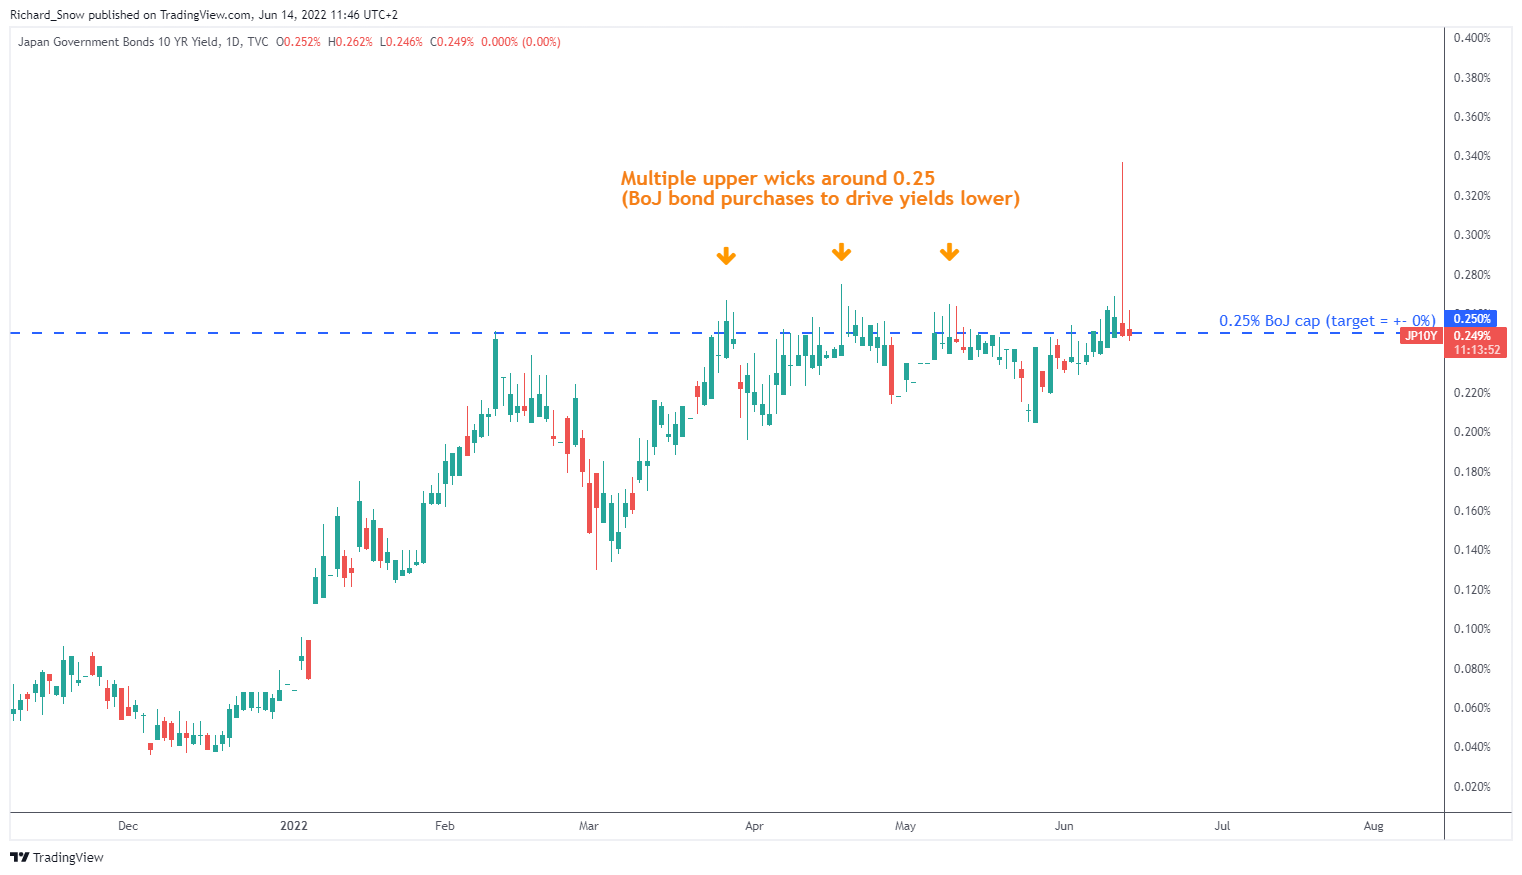
Source: TradingView, prepared by Richard Snow

USD/JPY Technical Levels to Consider
On the daily chart, USD/JPY appears to be consolidating between 135 and 134.50 as the market contemplates the next move. While it is difficult to make a case against the US dollar, prices look overbought at current levels – shown by the RSI. In addition, price action over the last few days offers little insight other than ‘indecision’, as small candle bodies are accompanied by extended wicks on both sides.
As such, if we are to see a lower move/pullback, the lowest wick around 133.20 becomes the tripwire for a potential drop lower followed by 131.35. On the upside, a break and hold above 135, could indicate the re-emergence of the bullish trend – something that could very well materialize should markets view tomorrow’s FOMC rate decision as hawkish. A potential 75 basis point hike would widen the current interest rate differential even more which could see the yen depreciate against the dollar further.
USD/JPY Daily Chart
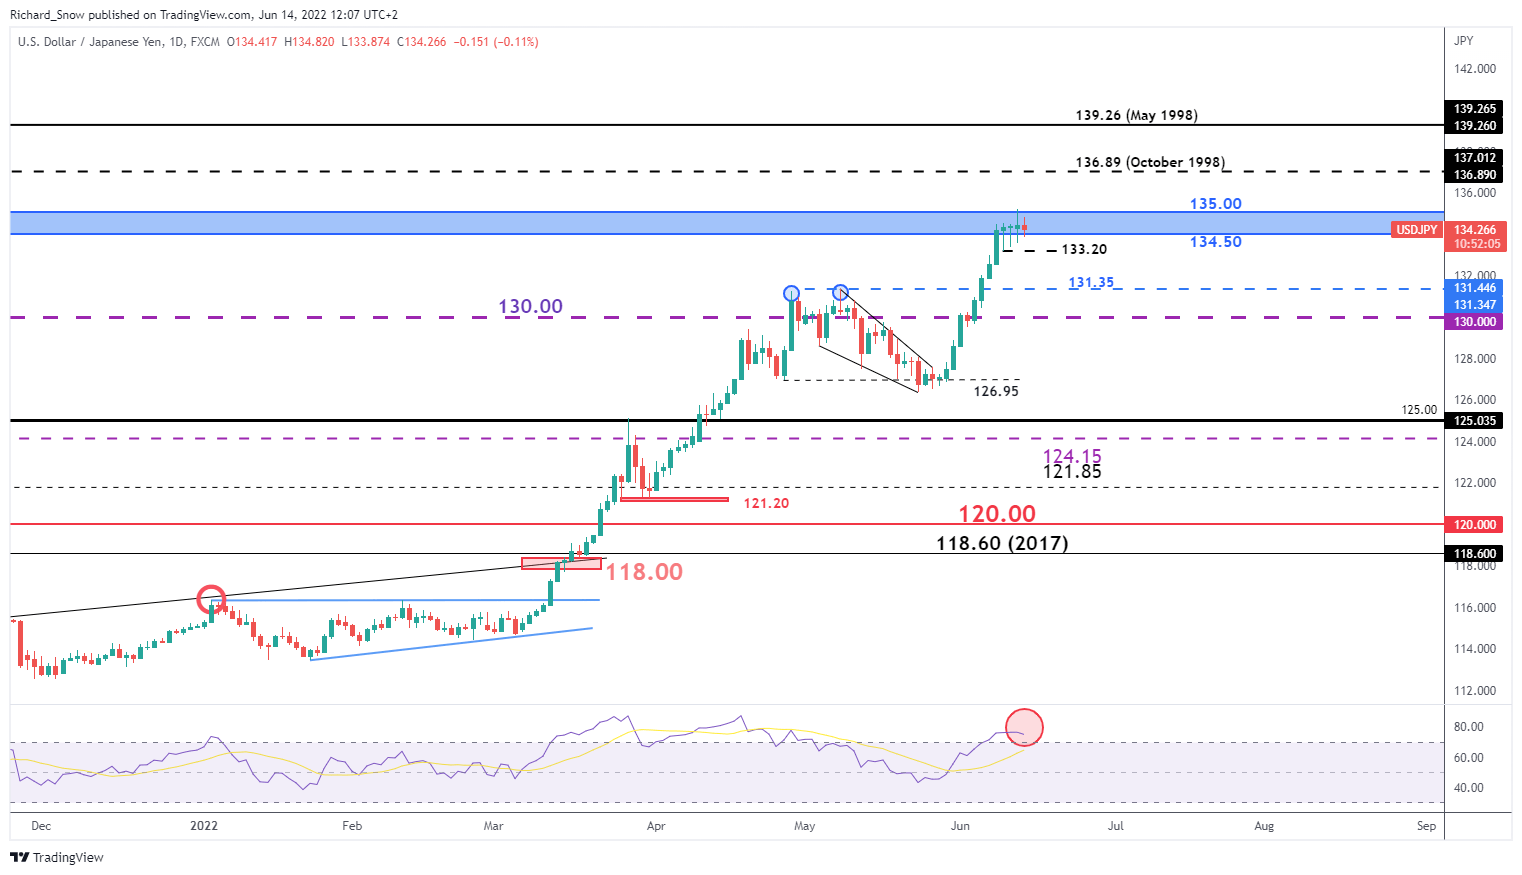
Source: TradingView, prepared by Richard Snow
The monthly chart comes in handy as the recent run of yen weakness has broken above all nearby resistance. Therefore, we now have to consider levels last seen in 1998 (136.89 and 139.26) for upside resistance.
USD/JPY Monthly Chart
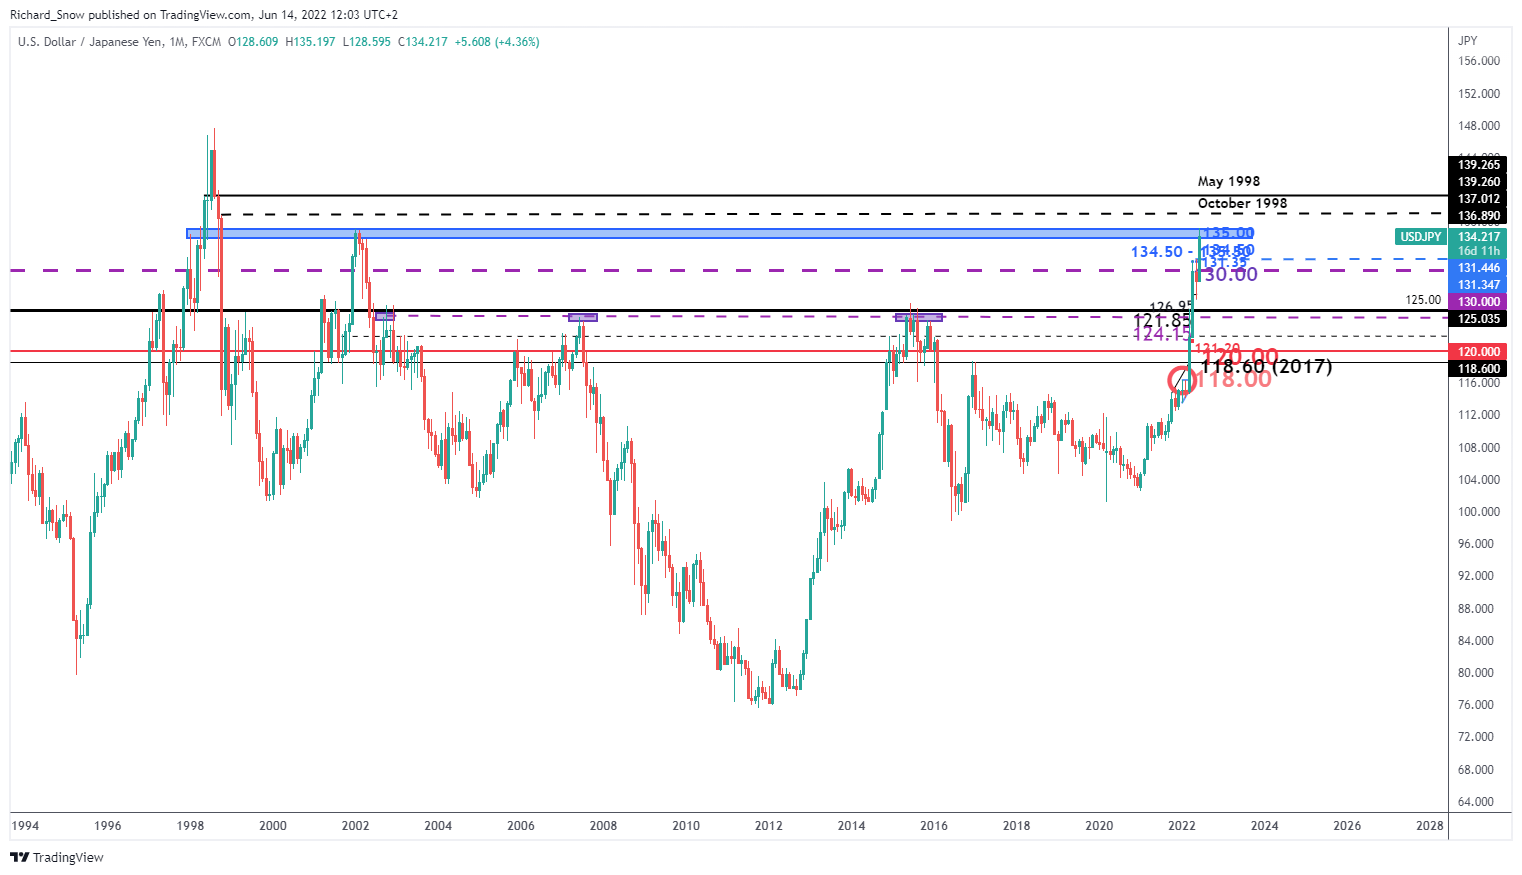
Source: TradingView, prepared by Richard Snow

Major Risk Events This Week
Without a doubt, the FOMC takes centre stage this week after a surprise to the upside in CPI inflation caused markets to recalibrate the pace of expected rate hikes, starting with tomorrows FOMC rate decision. The BoJ rate decision is expected to see no movement but recent jawboning from Tokyo and the BoJ could reinforce the overwhelming narrative that the recent sharp depreciation of the yen does more harm than good for the Japanese economy.
Customize and filter live economic data via our DaliyFX economic calendar
Trade Smarter - Sign up for the DailyFX Newsletter
Receive timely and compelling market commentary from the DailyFX team
--- Written by Richard Snow for DailyFX.com
Contact and follow Richard on Twitter: @RichardSnowFX


