


Australian Dollar, AUD/USD, AUD/JPY Trade, GDP, Commodities, RBA
- The Australian Dollar is unmoved by a stellar trade balance
- AUD has a solid fundamental backdrop but is struggling to rally further
- Will Japanese Yen weakness provide an opportunity in AUD/JPY?

The Australian Dollar held ground despite a trade balance reading that came in at AUD 10.5 billion for April, against AUD 9 billion anticipated and AUD 9.3 billion previously.
Today’s figures come after building approvals on Tuesday and GDP on Wednesday this week. Australian building approvals dropped -2.4% month-on-month in April instead of rising by 2.0% as expected.
Then 4Q quarter-on-quarter GDP came in at 0.8% against forecasts of 0.7% and a previous 3.4%. This made annual GDP to the end of March 3.3% instead of 3.0% anticipated and 4.2% prior. Upward revisions to previous quarters were also revealed.
Anecdotally, it seems that major flooding along a large swathe of Australia’s populous east coast may have impacted the building approval numbers.
A beat on GDP was a surprise as it covered a 3-month period that included those rain events and the further spread of the Omicron variant of Covid-19 impacting activity.
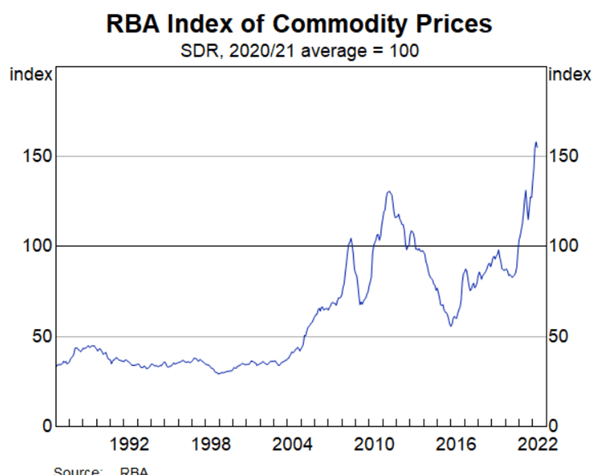
Additionally, the RBA published their commodity price index that accounts for the composition of Australian commodity exportsyesterday.
The monthly release showed a small drop of -2.4% for the month of May in special drawing rights (SDR) terms. The bigger picture reveals that it is up 30.4% year-on-year to the end of May in SDR terms and 33.7% in Australian Dollar terms.
These conditions lend themselves toward the RBA hiking rates next Tuesday. All in all, it would seem reasonable for the bank to raise by 40 basis points (bps) rather than a standard 25bps, which is something they considered at their May monetary policy meeting.
A rising domestic yield environment has seen AUD/JPY recover over 9% from the mid-May low. The cross rate is further enhanced by Japan’s reliance on importing their energy supplies, something Australia exports in bulk.
The Yen has resumed depreciating across the board as the Bank of Japan are maintaining loose monetary policy at a time when most of the world is tightening.
The other exception to tightening is China and traders should keep an eye on CNY/JPY for clues on broader Yen moves. If it continues to approach its recent record peak, it might signal the next pause on Yen weakening
For the Aussie Dollar, all of the above provides a sound fundamental backdrop but as always, it is subject to sways in risk sentiment and US Dollar gyrations.

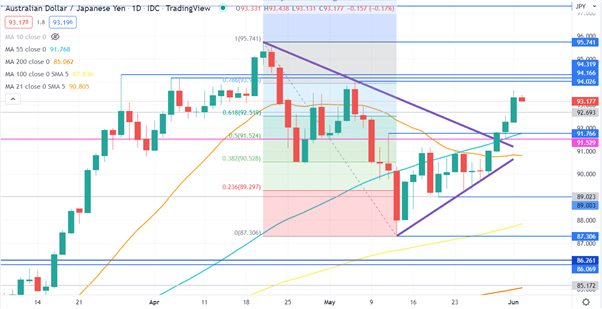
AUD/JPY TECHNICAL ANALYSIS
AUD/JPY cleared a cluster of technical resistance levels this week as identified here last week.
In sequence, it first cleared the 21- and 55-day simple moving averages (SMA), then the descending trend line as part of a Pennant formation at about the same time as it rose above a 50% Fibonacci Retracement level before eclipsing a recent high.
Breaking all these resistance levels at around the same time could now set-up that area as a support zone at 91.50 – 91.80.
If bullish momentum continues to unfold, AUD/JPY may test potential resistance at a cluster of break points and a prior high at 94.02 – 94.32.
--- Written by Daniel McCarthy, Strategist for DailyFX.com
To contact Daniel, use the comments section below or @DanMcCathyFX on Twitter


