


GBP/USD, EUR/USD, US Dollar Analysis and News:

The US Dollar goes from strength to strength as the index nears its pandemic peak at 103.00. Subsequently, its major counterparts have seen little reprieve with both the Euro and GBP remaining under significant pressure. What’s more, given that today is spot month end (two days before actual month end), also known as USD corporate dollar demand day, there may be little in the way of a let up in dollar strength. Therefore, with risks geared for another bout of USD demand, this is unlikely to bode well for both the Euro and GBP, maybe more so for the Pound, given the underperformance of the FTSE 100 over the S&P 500. Not to mention that with risk sentiment remaining soft, this adds additional weight to the Pound, putting the currency on a path to 1.25. For the USD, above the pandemic peak at 103 is the 2017 high at 103.82.
US Dollar Weekly Time Frame
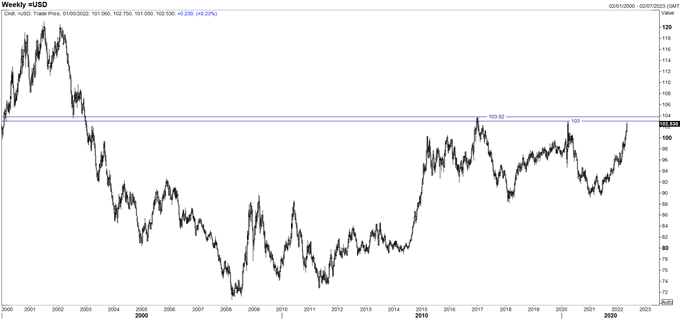
Source: Refinitiv
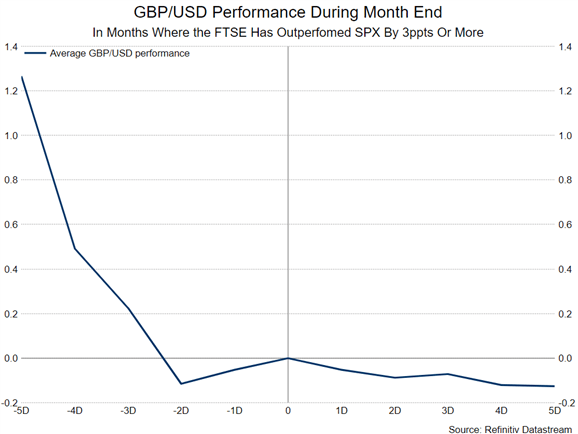
As it stands, the FTSE 100 has so far outperformed S&P 500 by 6ppts. Looking back, during periods where the FTSE 100 has outperformed SPX by at least 3ppts since 2010, GBP/USD has on average had a tendency to soften into month end (as shown below) with the typical performance on spot month end at -0.22% with a 66% hit rate.
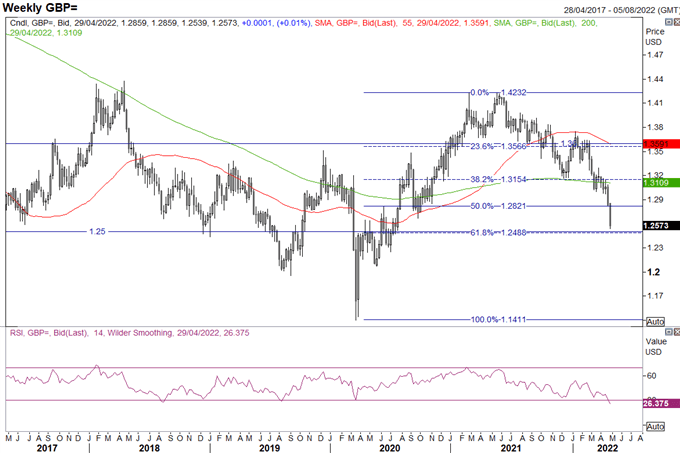
GBP Technicals to Watch
Since the break below the 1.30 handle, there has been little in the way of notable support with only the 1.25 figure in focus. That said, with the RSI deeply in oversold territory, while this does not necessarily mean we could see a sharp relief rally, it would be prudent to tighten stops if you are short.
| Change in | Longs | Shorts | OI |
| Daily | 3% | -7% | -3% |
| Weekly | 4% | -10% | -5% |
Source: Refinitiv
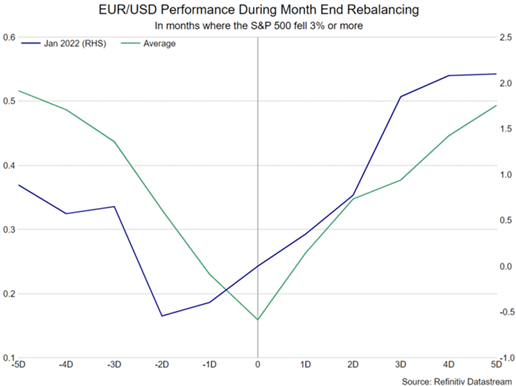
At the same time, with the S&P 500 posting a MTD loss of 7%. The chart below highlights the average performance of EUR/USD during month end, in which the USD picks up in the last few days of the month, before retracing the move in the following week.
Trade Smarter - Sign up for the DailyFX Newsletter
Receive timely and compelling market commentary from the DailyFX team


