


GBP/USD ANALYSIS
- Cable recovers after early losses.
- GBP/USD testing key area of confluence.
CABLE FUNDAMENTAL FORECAST: BEARISH

Cable attempted to claw back losses this week after yesterday’s stronger than expected UK inflation data, while the U.S. dollar slipped below the psychological 100 mark on the Dollar Index (DXY). Markets revised U.S. inflation lower as shown by the graph below however, with supply chain bottlenecks still causing inflationary pressure, I think the decline will not be as rapid as currently priced in leaving room for GBP/USD upside.
U.S. 5-YEAR FORWARD INFLATION LINKED SWAP

Source: Refinitiv
During the European session on Thursday, the dollar rallied with support from a positive April consumer sentiment beat (see economic calendar below), while mixed jobless claims and retail sales data were taken in a positive light.
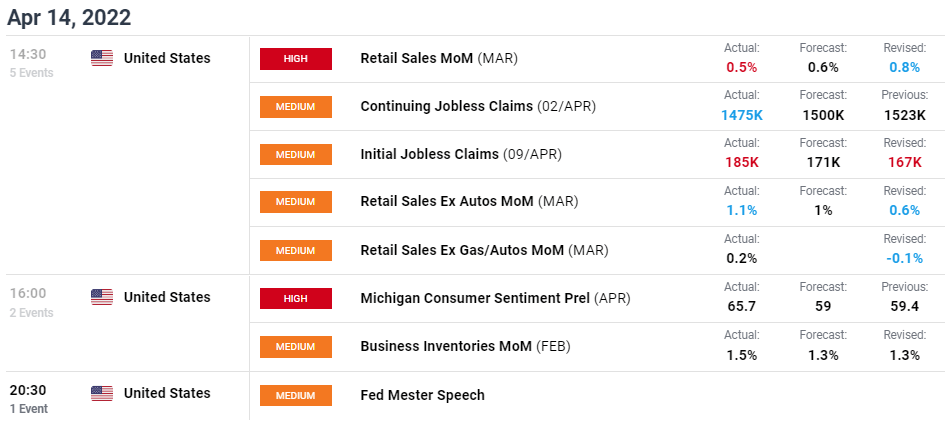
Source: DailyFX Economic Calendar

Next week the only high impact economic data comes from the UK in the form of PMI data which is expected to come in slightly lower than previous readings. A weaker than expected figure could add to bearish bets on the cable pairing. The UK economy does not seem to be in good shape relative to the U.S. with consumer confidence on the decline, rampant inflation and the end of free COVID-19 testing could add to negative data prints to come.
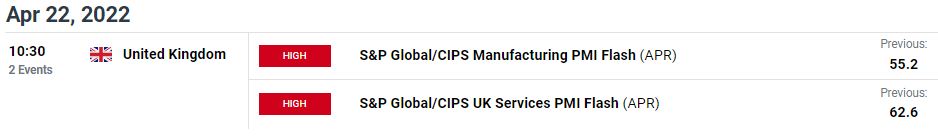
Source: DailyFX Economic Calendar
GBP/USDTECHNICAL ANALYSIS
GBP/USD DAILY CHART

Chart prepared by Warren Venketas, IG
The daily GBP/USD chart shows price action pushing off support at 1.3000 coinciding with the upward sloping trendline on the RSI indicator (blue). As of yet, bulls have defended the 1.3000 support level but should markets revisit this key area of support, I believe it is only a matter of time before it gives way in the medium-term. Short-term, there is still room for a move towards the 1.3164 (38.2% Fibonacci) before a subsequent move lower.
Key resistance levels:
Key support levels:
- 1.3000
- Lower channel trendline (black)
BEARISH IG CLIENT SENTIMENT
IG Client Sentiment Data (IGCS) shows retail traders are currently LONG on GBP/USD, with 73% of traders currently holding long positions (as of this writing). At DailyFX we typically take a contrarian view to crowd sentiment resulting in a downside bias.
Contact and follow Warren on Twitter: @WVenketas


