


RAND ANALYSIS
ZAR FUNDAMENTAL BACKDROP
The resilient rand may be coming under pressure as its commodity sustenance continues to decay. Despite the sharp downturn in rand-linked exports, a surge in Chinese COVID-19 cases brought with it concerns over China’s growth leaving the highly correlated ZAR exposed to downside risk.
The addition of the upcoming Fed interest rate hike expectation (25bps) is contributing to a diminished carry trade appeal for the rand but has been largely priced in with money markets almost eliminating the prospect of anything more aggressive. The key to tomorrow’s meeting lies in the post-announcement press conference where I expect hawkish comments from Fed Chair Jerome Powell which could open up the possibility of further USD/ZAR upside.
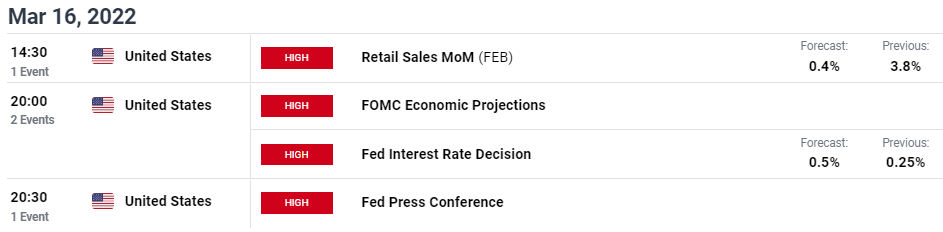
Source: DailyFX economic calendar

The beginning of 2022 paints a similar picture to that of 2021 where the rand appreciated against the US dollar, after which these gains were swiftly washed away. I anticipate something comparable (albeit drastically different variables at play) with local issues becoming ever more apparent as global economic conditions have been center stage.
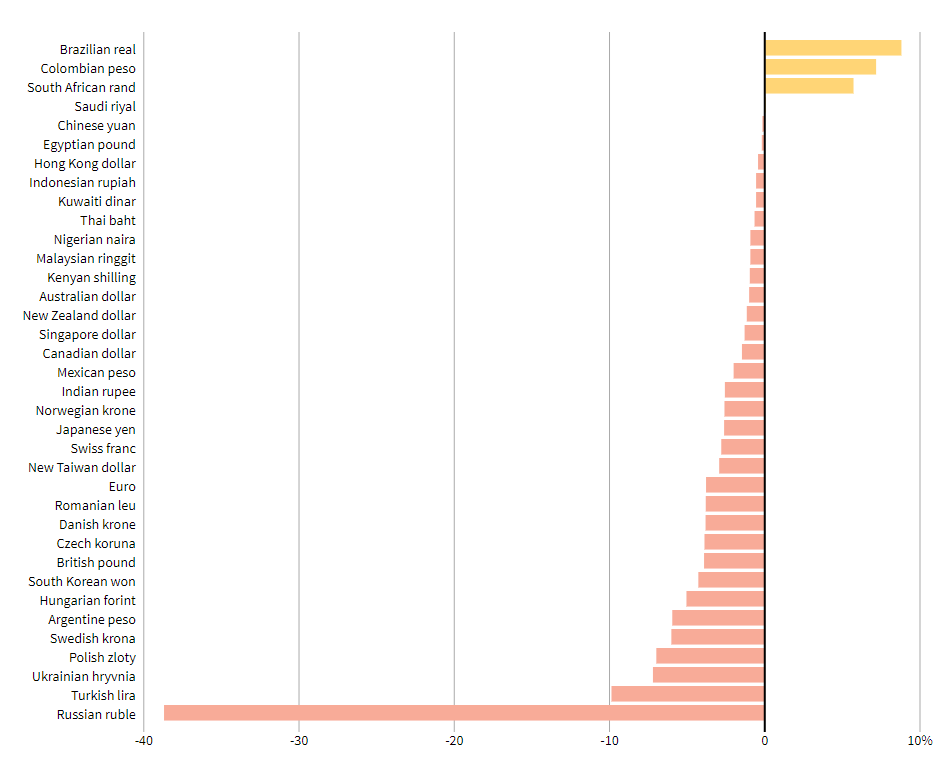
Source: Reuters
TECHNICAL ANALYSIS
USD/ZAR DAILY CHART
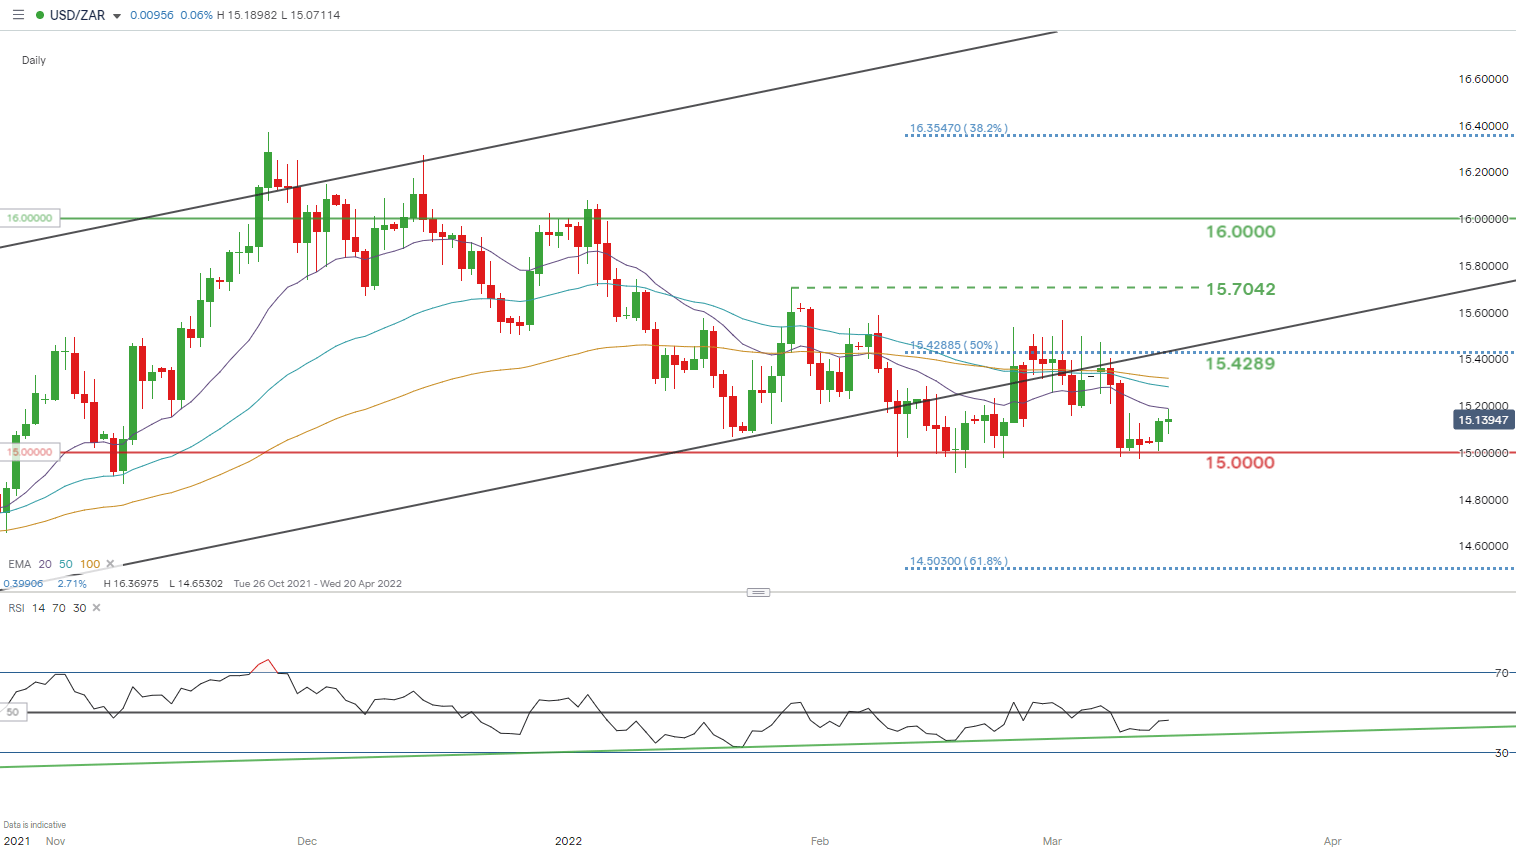
Chart prepared by Warren Venketas, IG
USD/ZAR price action has been some tracking commodity and Chinese linked movements this week leaving the 15.0000 psychological support zone intact. Today’s highs found resistance from the 20-day EMA (purple) after positive Chinese economic data prints this morning. The Relative Strength Index (RSI) has followed the 15.0000 level with an upward trending slope (green) with minimal chance of a price break unless the Fed disappoints on the dovish-side tomorrow.
Resistance levels:
Support levels:
- 15.0000
Trade Smarter - Sign up for the DailyFX Newsletter
Receive timely and compelling market commentary from the DailyFX team
Contact and follow Warren on Twitter: @WVenketas


