


U.S. DOLLAR ANALYSIS
- U.S. CPI (JAN) – HEADLINE ACT: 7.5%, EST: 7.3%; CORE ACT: 6.0%, EST: 5.9%
**UPDATE**
U.S. INFLATION PRINT INCREASES HAWKISH FED BETS
Inflation for the January period exceeded expectations (see calendar below). This adds further tightening pressure on the Federal Reserve to start hiking rates giving added impetus to dollar upside.
US CPI (JAN):
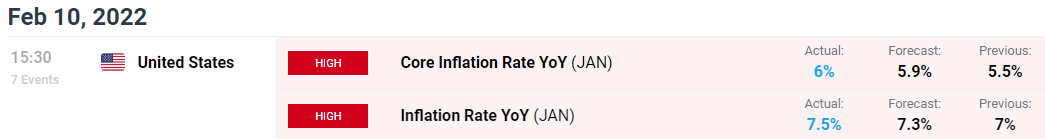
Source: DailyFX economic calendar

The bond market continued to push yields higher particularly on the short-end (2Y) with the 10s following suit reaching fresh 2022 highs.
TECHNICAL ANALYSIS
U.S. DOLLAR INDEX DAILY CHART
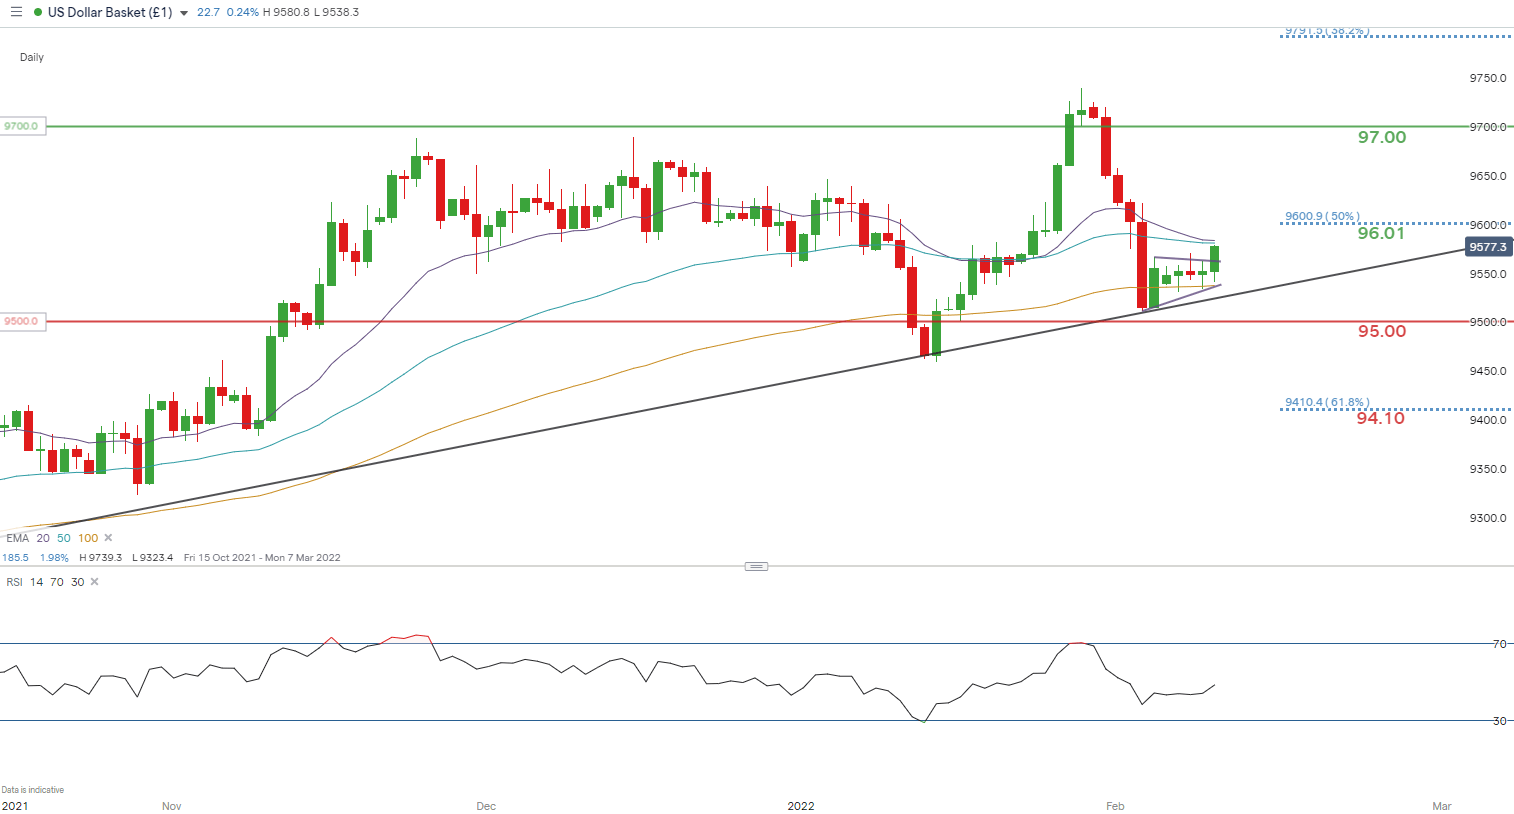
Chart prepared by Warren Venketas, IG
Post-announcement, the DXY reacted positively with a breakout of the short-term symmetrical triangle (purple). The threatening bearish EMA crossover has now almost immediately reverted with the 20-day EMA diverging from the 50-day level.
Resistance levels:
- 97.00
- 96.01
Support levels:
- 95.00
- 94.10
NASDAQ DAILY CHART

Initial NASDAQ (US Tech) price action has expectedly dropped on the back of higher US Treasury yields which tend to have a negative relationship with tech stocks. This is due to growth stock future earnings valuations being hampered by rising yields.
EUR/USD DAILY CHART

EUR/USD is now testing the 1.1400 psychological level as well as the falling wedge formation. The pattern is not invalidated just yet and could unfold once markets digest the release.
Trade Smarter - Sign up for the DailyFX Newsletter
Receive timely and compelling market commentary from the DailyFX team
Contact and follow Warren on Twitter: @WVenketas


