


GBP price, news and analysis:
- GBP/USD has been falling steeply since Friday, largely due to USD strength.
- That weakness could well persist as the pair nears critical support levels.
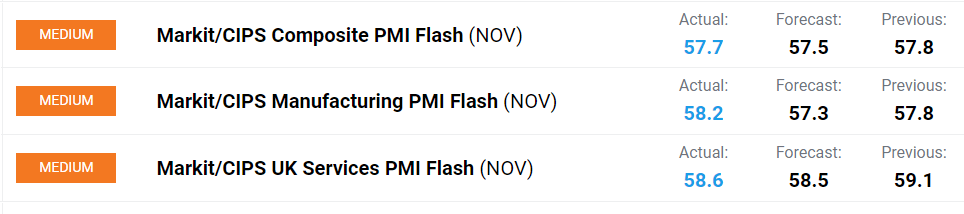
- The UK flash purchasing managers’ indexes (PMIs) for November, released this session, came in above economists’ expectations but had no impact on GBP.
GBP still under downward pressure
GBP/USD will likely extend the falls that began last Friday as the US Dollar continues to benefit from the reselection of Jay Powell as chair of the US Federal Reserve. His reappointment is now expected to be a formality, and that could well mean a faster withdrawal of US monetary stimulus and several US interest rate increases next year.
Moreover, the prospect of a UK interest rate hike when the Bank of England’s monetary policy committee next meets on December 16 is still fully priced in to the markets, meaning there is little upside for GBP/USD if that’s confirmed, and substantial downside if it isn’t. Pricing puts the chances of a rate rise to 0.25% from the current 0.10% at 100%.
Turning to the GBP/USD chart, the first important support level is the 1.3353 low touched on November 12, with trendline support at 1.3280. If those break, the pair will be back at levels not seen since December 2020. Note too that the 14-day relative strength index (RSI) at the bottom of the chart below remains above the 30 oversold level.
GBP/USD Price Chart, Daily Timeframe (September 21, 2020 – November 23, 2021)
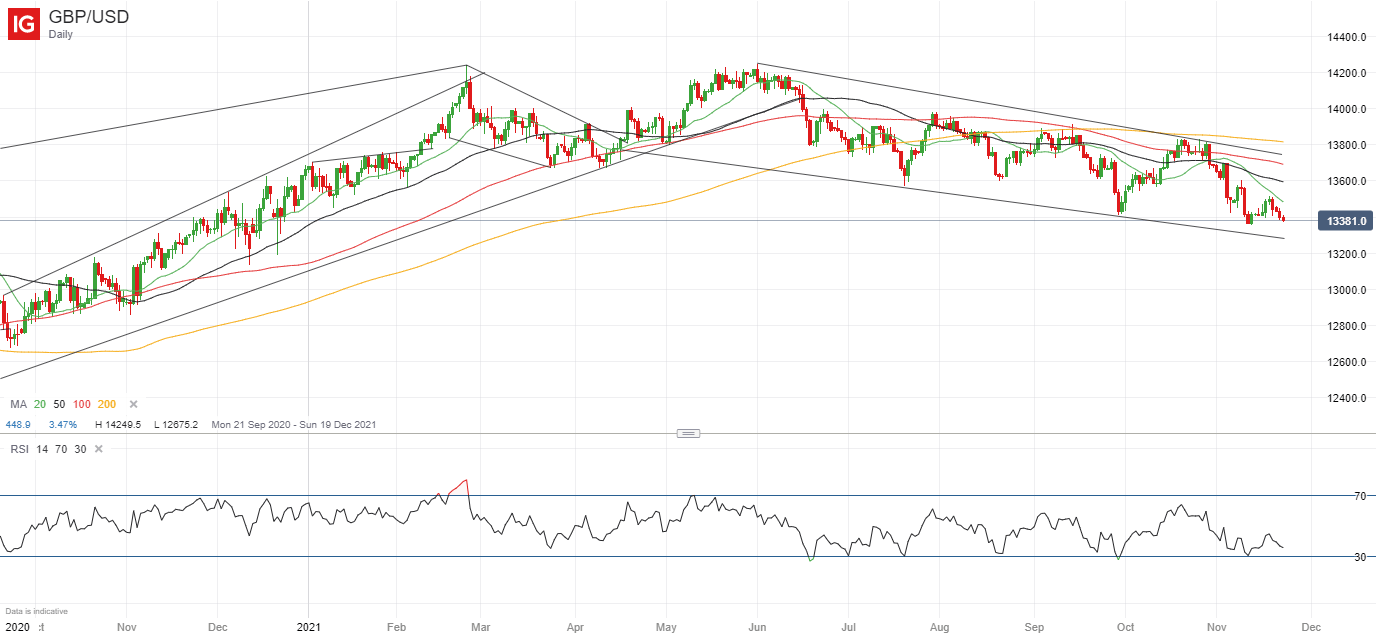
Source: IG (You can click on it for a larger image)

UK PMIs higher than expected
In the news, the November flash PMIs for the UK all came in above the consensus forecasts of economists polled by the news agencies. The composite index was still down marginally from October but the manufacturing index actually rose.
As for sentiment, IG client positioning data for GBP/USD are also suggesting further falls for GBP/USD. The retail trader data show 71.66% of traders are net-long, with the ratio of traders long to short at 2.53 to 1. The number of traders net-long is 7.68% higher than yesterday but 5.28% lower than last week, while the number of traders net-short is 0.33% lower than yesterday and 5.67% lower than last week.
Here at DailyFX, we typically take a contrarian view to crowd sentiment, and the fact traders are net-long suggests GBP/USD prices may continue to fall. Traders are further net-long than yesterday and last week, and the combination of current sentiment and recent changes gives us a stronger GBP/USD-bearish contrarian trading bias.

-- Written by Martin Essex, Analyst
Feel free to contact me on Twitter @MartinSEssex


