


RAND ANALYSIS
- Market sentiment rejects riskier rand.
- Key U.S. data prints may be overshadowed by COVID-19 situation.
- USD/ZAR channel break.
ZAR FUNDAMENTAL BACKDROP
YEARLY HIGHS FOR USD/ZAR AS RISK OFF SENTIMENT GRIPS FX MARKETS
Last week’s Emerging Market (EM) currency selloff was underway after Turkey’s central bank decided to cut interest rates and continued into Friday’s market close when European COVID-19 cases sparked contagion fears. Today, the rand opened marginally higher against the U.S. dollar despite its safe-haven appeal as pandemic uncertainties remain. Other traditional safe-havens such as the Japanese Yen (JPY) and Swiss Franc (CHF) have extended their gains which could see the rand weaken against the greenback as the trading day progresses.
U.S. ECONOMIC DATA IN FOCUS THIS WEEK
U.S. manufacturing PMI data and core PCE inflation data (Fed’s preferred metric) are expected this week (see economic calendar below)however higher than forecasted prints may not have the conventional effect this week as markets mull over the COVID-19 situation in Europe. A cagey approach may be adopted as the potential of a broadening pandemic could further dampen hawkish prospects. From a USD/ZAR perspective, the rand remains vulnerable to further weakness while global influences dictate.
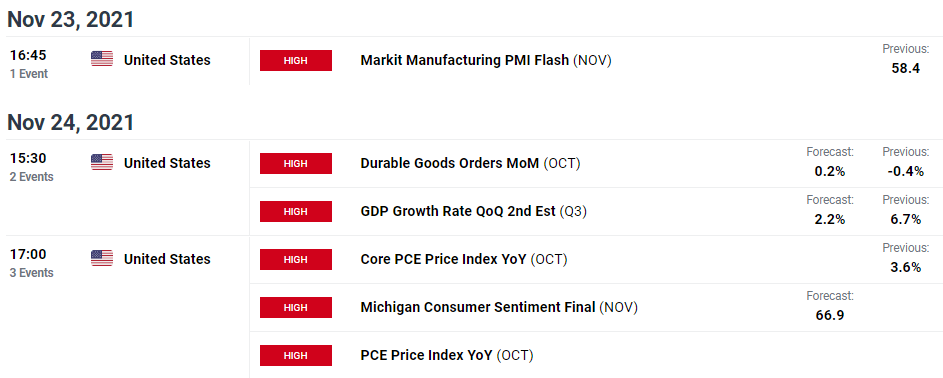
Source: DailyFX economic calendar

TECHNICAL ANALYSIS
USD/ZAR DAILY CHART
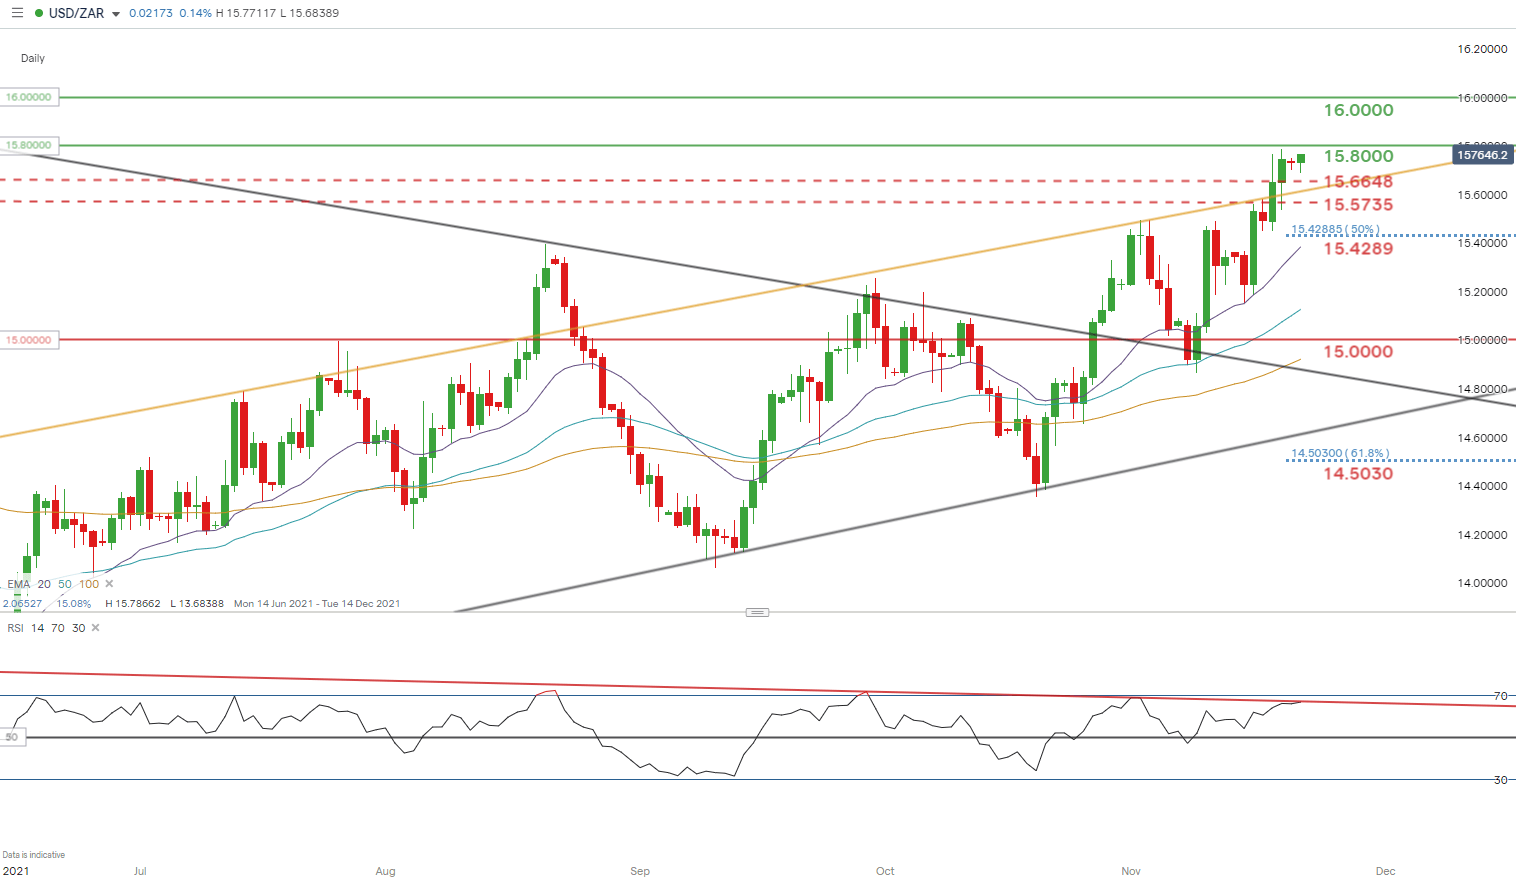
Chart prepared by Warren Venketas, IG
On Friday, we saw fresh yearly highs come into play as the January swing high at 15.6648 resistance level was breached by a daily candle close. The long standing resistance now turned support will be an important level to monitor this week. Channel resistance (yellow) was included in the upside rally and coincides with the 15.6648 level.
Should price action remain above 15.6648 and channel resistance we could see bulls pushing for the 16.0000 psychological handle – last seen in November 2020.
The Relative Strength Index (RSI) is suggestive of bearish divergence which eludes to the contradictory move in USD/ZAR price action (higher highs) to the RSI indicator (lower highs). Traditionally, technical analysts use this as a bearish signal whereby prices are expected to reverse from their current bullish trajectory. A tentative approach should be exercised with this method as timings can be uncertain.
Resistance levels:
- 16.0000
- 15.8000
Support levels:
- 15.6648 – January 2021 swing high/channel resistance (yellow)
- 15.5735
- 15.4289 – 50% Fibonacci level
Trade Smarter - Sign up for the DailyFX Newsletter
Receive timely and compelling market commentary from the DailyFX team
Contact and follow Warren on Twitter: @WVenketas


