


NDX ANALYSIS
- Real yields a key contributor to U.S. tech upside.
- NDX rallies as Fed Chair Powell is re-elected.
NASDAQ 100 INDEX EXTENDS TO ALL-TIME-HIGHS
The endurance of the U.S. stock market stems from falling real yields and accommodative policy environment. Although the Federal Reserve has announced its QE taper directives, the fundamental backdrop and access to liquidity remains supportive for U.S. companies.
Real yields represent the return an investor receives after adjusting for inflation. The relationship real yields have with the stock market is inverse, meaning investors are receiving lesser return in the bond market due to inflationary pressure as opposed to the stock market which can offer higher returns. This simple formula has been sustaining the extraordinary bull run since early 2020.
Despite bouts of higher U.S. 10-year Treasury yields which have a negative effect on tech stock valuations (see chart below), Treasury yields linger at historically low levels.
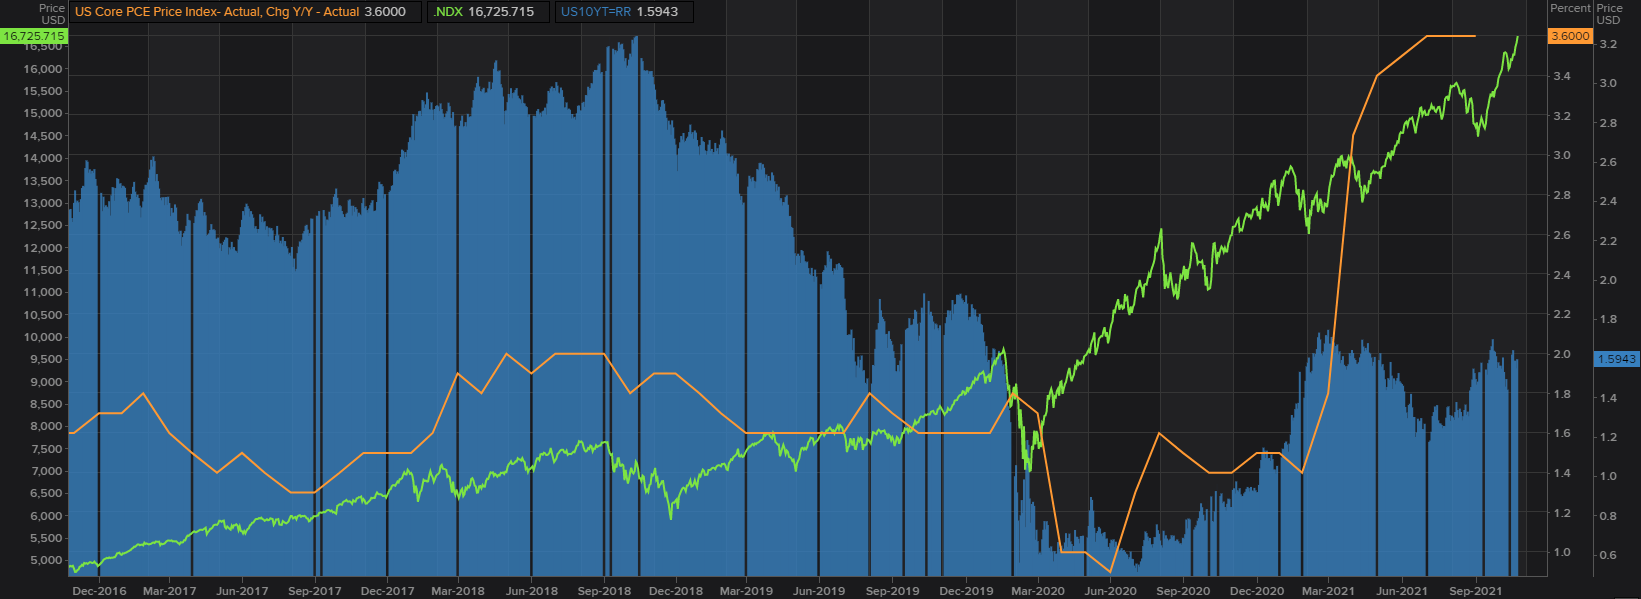
Chart prepared by Warren Venketas, Refinitiv Datastream
Year-to-date, the NDX is up roughly 25% and with the announcement of Fed Chair Powell to serve a second term in his current role, markets rallied as any doubts around policy uncertainty has been dismissed. Sectors outperforming today are shown in the graphic below:
Boost your stock market knowledge with our articles on the types of stocks available, how equities impact the economy, and getting started with stock trading.
NDX SECTOR SUMMARY
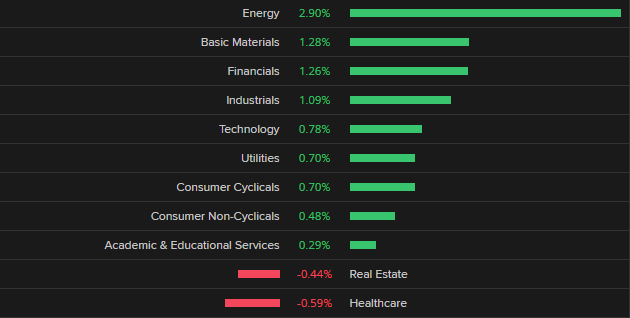
Source: Refinitiv
Stock highlights today:
- iSpecimen receives contract from U.S. government to assist in advanced COVID-19 research – iSpecimen +140.5%
- Vonage to be acquired by Ericsson for $6.2bn – Vonage +25.2%
- Model S Plaid to launch in China around March – Tesla +4.7%
- Astra Space rocket launch reaches space, gets boost from Musk shoutout – Astra Space +36.62%
NASDAQ COMPOSITE INDEX TECHNICAL ANALYSIS
NDX Daily Chart:
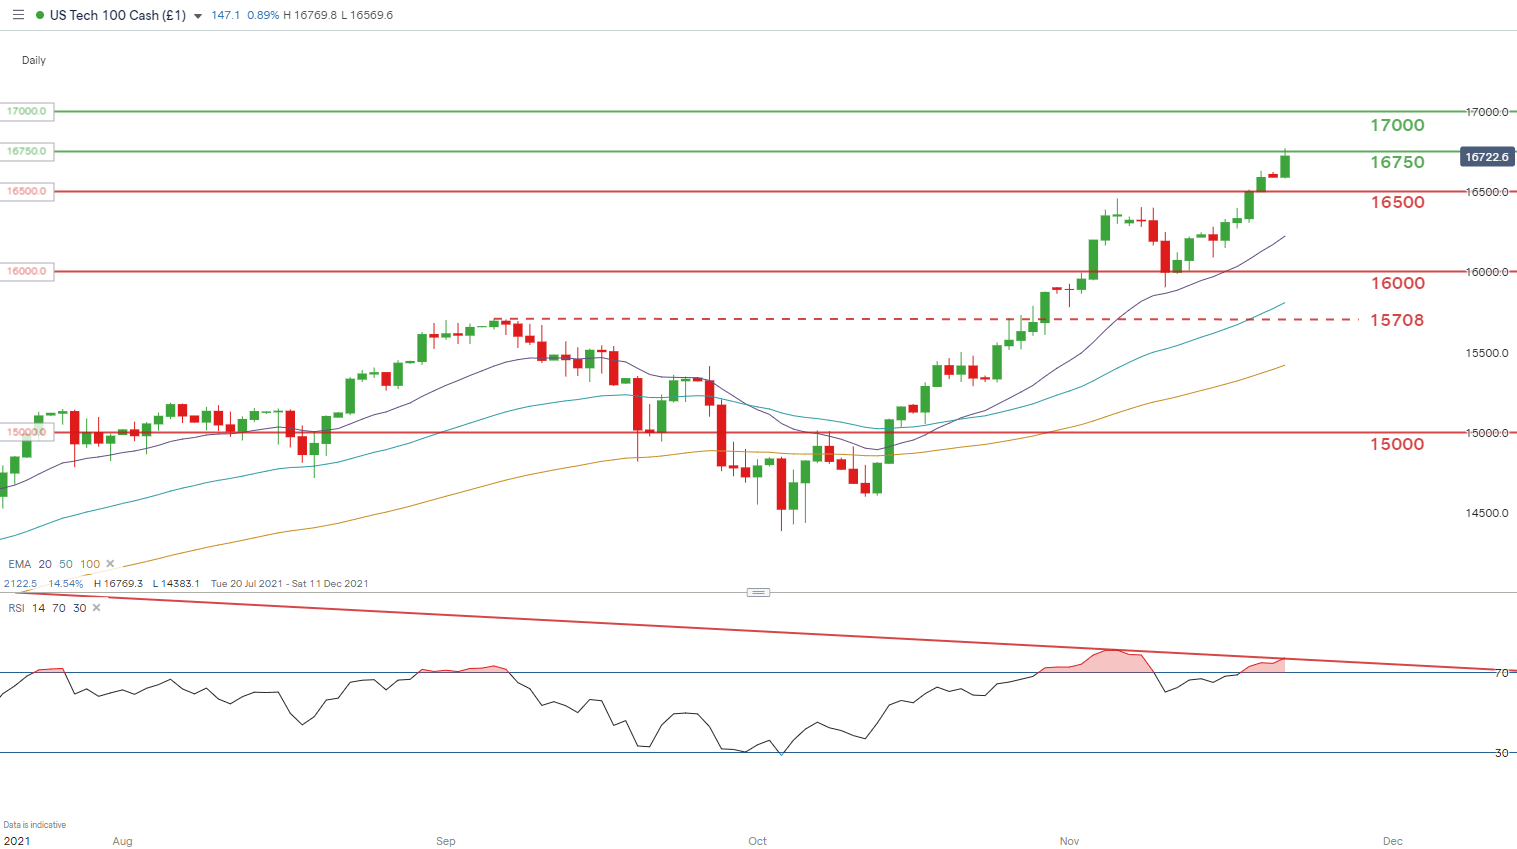
Chart prepared by Warren Venketas, IG
The daily NDX chart above reflects the recent rally since early October 2021. Markets are now testing new ground as the key 17000 psychological level is in reach. The steep and swift move to current levels are somewhat extended and reversion to the mean may be on the cards short-term.
The Relative Strength Index (RSI) supports this notion (lower highs) in the form of bearish divergence (red) which contradicts price action on the NDX chart (higher highs). Technically, this is indicative of an impending downside reversal/correction which could bring in to focus subsequent support levels.
Resistance levels:
- 17000
- 16750
Support levels:
- 16500
- 20-day EMA (purple)
Trade Smarter - Sign up for the DailyFX Newsletter
Receive timely and compelling market commentary from the DailyFX team
Contact and follow Warren on Twitter: @WVenketas


