


Nasdaq 100, Nikkei 225, Non-Farm Payrolls, Fed, Technical Analysis – Asia Pacific Indices Briefing
- Nasdaq 100 shined as S&P 500, Dow Jones fell behind on mixed NFPs
- APAC markets eye illiquid trading conditions, Wall Street offline ahead
- Nikkei 225 looking for follow-through after best week since May 2020
Trade Smarter - Sign up for the DailyFX Newsletter
Receive timely and compelling market commentary from the DailyFX team
Friday’s Wall Street Trading Session Recap
Most stocks on Wall Street ended last week on a downbeat after August’s mixed non-farm payrolls report, with the Dow Jones and S&P 500 falling 0.21% and 0.03% respectively. It was the tech sector that managed to find some life, with the Nasdaq 100 gaining 0.32% as it closed at a record high. Despite this, the Nasdaq was unable to overtake upper wicks left behind in the preceding trading sessions.
The US only added 235k jobs in August, far lower than the 733k projection. However, the unemployment rate declined to 5.2% from 5.4%, as anticipated. Meanwhile, wage data beat estimates. Average hourly earnings shot higher to 4.3% y/y from 4.1% in July, above the 3.9% consensus. That was the most since August. Meanwhile, the labor force participation rate held at 61.7%. Economists were looking for a rise to 61.8%.
On balance, it seems that the non-farm payrolls report probably took away expectations that the Federal Reserve might begin tapering asset purchases this month. However, that it could start this year seems to remain in the cards. This may explain the reaction in stock markets. A delay to unwinding lose policy seems more pertinent to growth-centered stocks.
Nasdaq 100 Technical Analysis
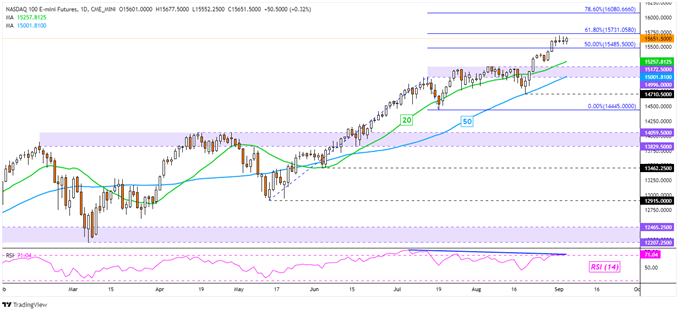
The Nasdaq 100 sits in-between the midpoint and 61.8% Fibonacci extension level at 15485 and 15731 respectively. While the index has been in an uptrend, negative RSI divergence continues to persist. This shows that upside momentum is fading, which can at times precede a turn lower. Such an outcome may place the focus on the 20-day Simple Moving Average.
Introduction to Technical Analysis
Candlestick Patterns
Recommended by Daniel Dubrovsky
Nasdaq 100 Futures – Daily Chart
Monday’s Asia Pacific Trading Session
A lack of prominent economic event risk during Monday’s Asia-Pacific trading session likely places risk trends as the key market driver. Given the lackluster performance on Wall Street, equities may struggle to find material upside momentum. With US bourses offline on Monday for the Labor Day holiday, illiquid trading conditions could make their way into markets. All eyes have lately been on Japanese stocks. Last week, Japan’s Prime Minister Suga announced his plan to step down as the leader of the LDP Party. Expectations of a new leader are also bringing with it more calls for fiscal economic support. Hence the rise in the Nikkei 225.
Trading Strategies and Risk Management
Global Macro
Recommended by Daniel Dubrovsky
Nikkei 225 Technical Analysis
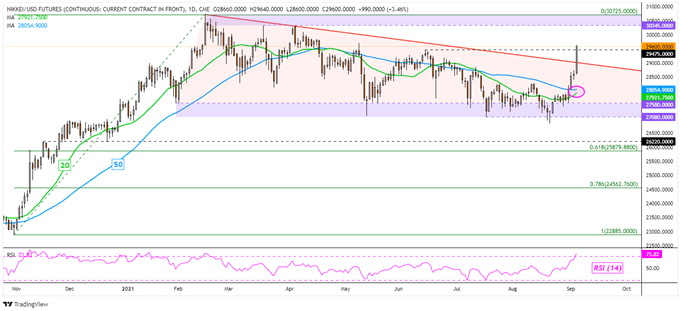
Nikkei 225 futures soared 6.23% last week, the best 5-day performance since May 2020. Moreover, the index broke above a Descending Triangle chart pattern. This could spell a resumption of the uptrend that occurred from March 2020 through February 2021. A bullish Golden Cross between the 20- and 50-day Simple Moving Averages may form on the horizon, underscoring an upside technical bias. Further gains may place the focus on the key 30345 – 30725 resistance zone.
Nikkei 225 Futures – Daily Chart
--- Written by Daniel Dubrovsky, Strategist for DailyFX.com
To contact Daniel, use the comments section below or @ddubrovskyFX on Twitter


