


Swiss Franc Technical Forecast – Talking Points
- USD/CHF may continue 2020 downtrend on triangle break
- GBP/CHF rebounds above key moving average within channel

USD/CHF Technical Forecast
Since January, the Swiss Franc surrendered ground versus the US Dollar, with USD/CHF up nearly 3.5% on a year-to-date basis. However, a Symmetrical Triangle pattern has taken shape through this year. That may result in the currency pair breaking lower and continuing the preceding downtrend. The Franc gained nearly 10% versus the Greenback in 2020.
Currently, prices are perched above the 100-day Simple Moving Average, which has been providing support since early August after prices bounced higher from triangle support. While symmetrical triangles typically lead to a continuation of the prior trend, a breakout higher is not off the cards. Prices may continue to consolidate within the pattern, but a slightly bearish bias is present while in the triangle.
USD/CHF Daily Chart
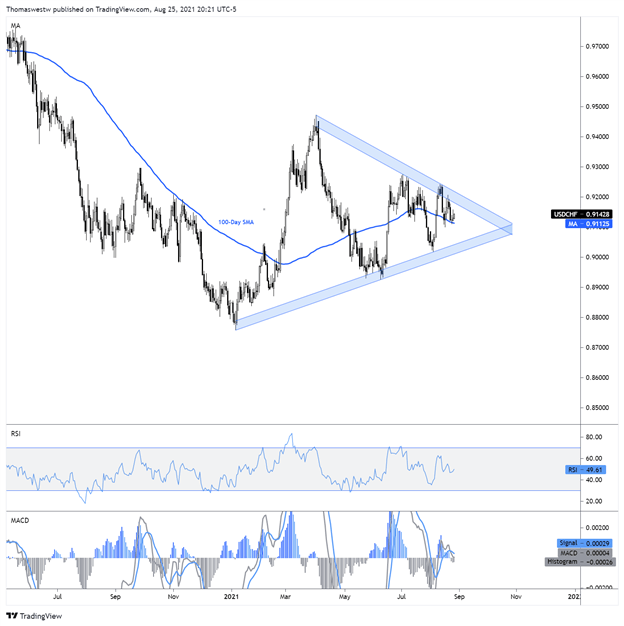
Chart created with TradingView

GBP/CHF Technical Forecast
The Swiss Franc’s technical posture against the British Pound has improved in recent months after weakening sharply in the first quarter of this year. GBP/CHF is now trading within a descending channel. The currency pair rebounded from support last week after falling quickly from the upper bound of the channel in early August.
The rising 200-day Simple Moving Average (SMA) appeared to provide a level of support after CHF bulls failed to maintain downward momentum below the key level. MACD and RSI are turning higher currently, with the MACD line eyeing a cross above its signal line, a bullish sign. That said, prices may rise to test the channel’s resistance level again. That puts the short-term outlook in a bullish position, although beyond that, a move lower looks more likely.
GBP/CHF Daily Chart
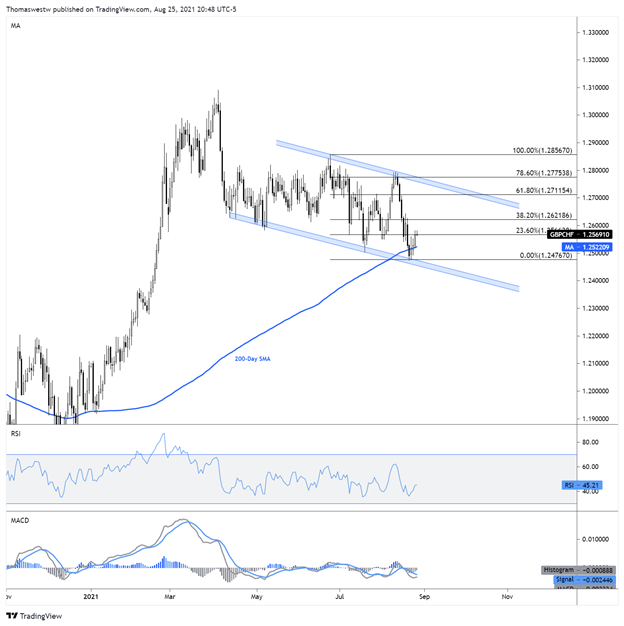
Chart created with TradingView

Written by Thomas Westwater, Analyst for DailyFX.com
To contact Thomas, use the comments section below or @FxWestwater on Twitter


