


S&P 500, Nasdaq 100, Netflix, Dow Jones Earnings - Talking Points
- S&P 500, Nasdaq 100, and Dow Jones all rebound sharply following Monday’s sell-off
- Netflix reports mixed results, earnings and subscriber growth both fall short of expectations
- US 10 Year Treasury Yield bounces, pushing cyclical stocks to outperform on Tuesday

Major US benchmarks advanced during Tuesday’s session as market participants “bought the dip” from Friday and Monday. Tuesday’s rebound was fueled by a slight bounce in Treasury yields, as the 10-year yield rose to 1.20%. The move higher in yields eased worries about a slowing global recovery, as a resurgence of COVID has raised fears over potential lockdowns and restrictions. Monday’s session was the worst day for the Dow Jones index in over 8 months.
Kicking off FAANG earnings, Netflix posted mixed results after the bell on Tuesday. The streaming giant reported better than expected revenues, but earnings and subscriber growth both fell short of forecasts. 2Q EPS came in at $2.97 per share against estimates of $3.14. Revenues totaled $7.34 billion, beating the consensus estimate of $7.32 billion. In immediate trade Netflix retreated, falling below $500 per share and testing an ascending trendline from the March 2020 low. Following the trendline test shares rebounded slightly, trading back up to $525 and just below the 0.5 Fibonacci retracement level at $526.
Netflix Daily Chart
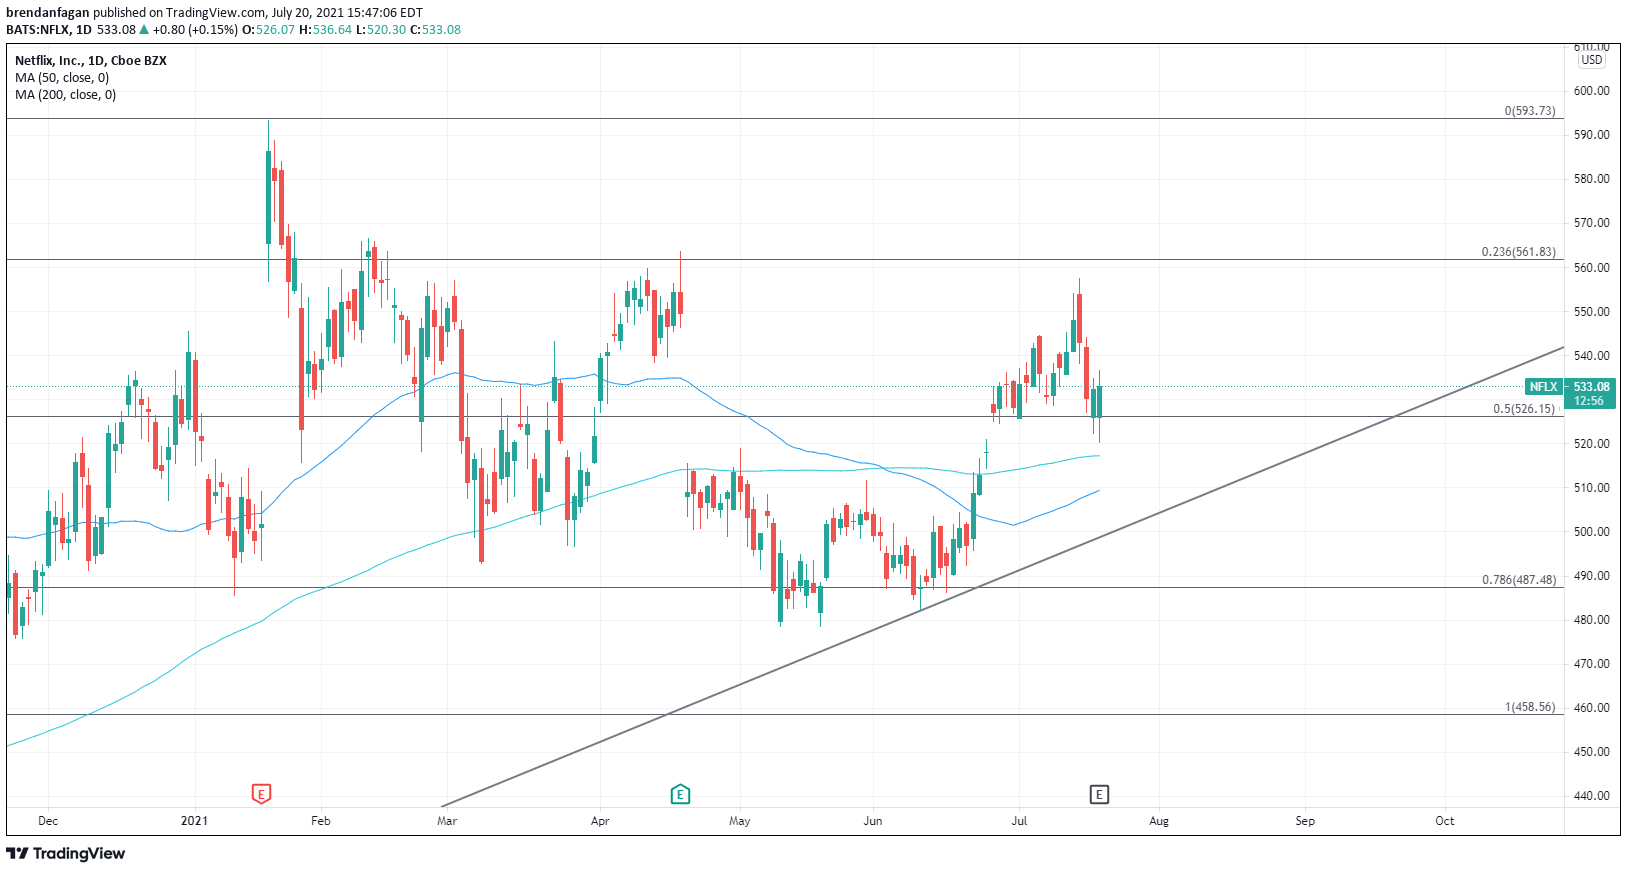
Chart provided by TradingView

Market participants may remain fixated on the bond market as questions remain regarding the severity and conviction of the recent pullback. Despite the sharp decline on Monday, the S&P 500 sits just 2% off all-time highs which may explain why overall sentiment remains relatively strong. However as the 10-year Treasury yield sits at a near 5 month low, questions linger surrounding the genesis of the recent movement in the bond market. It may just be that bond market participants are pricing in slower growth and more aggressive Fed tightening in the short-end, which would explain the recent flattening of the yield curve. Nonetheless a continued bond bid may spook investors once again, causing the S&P 500 to retest its 50-day moving average as it did during Monday’s session.
US 10Y Yield Daily Chart
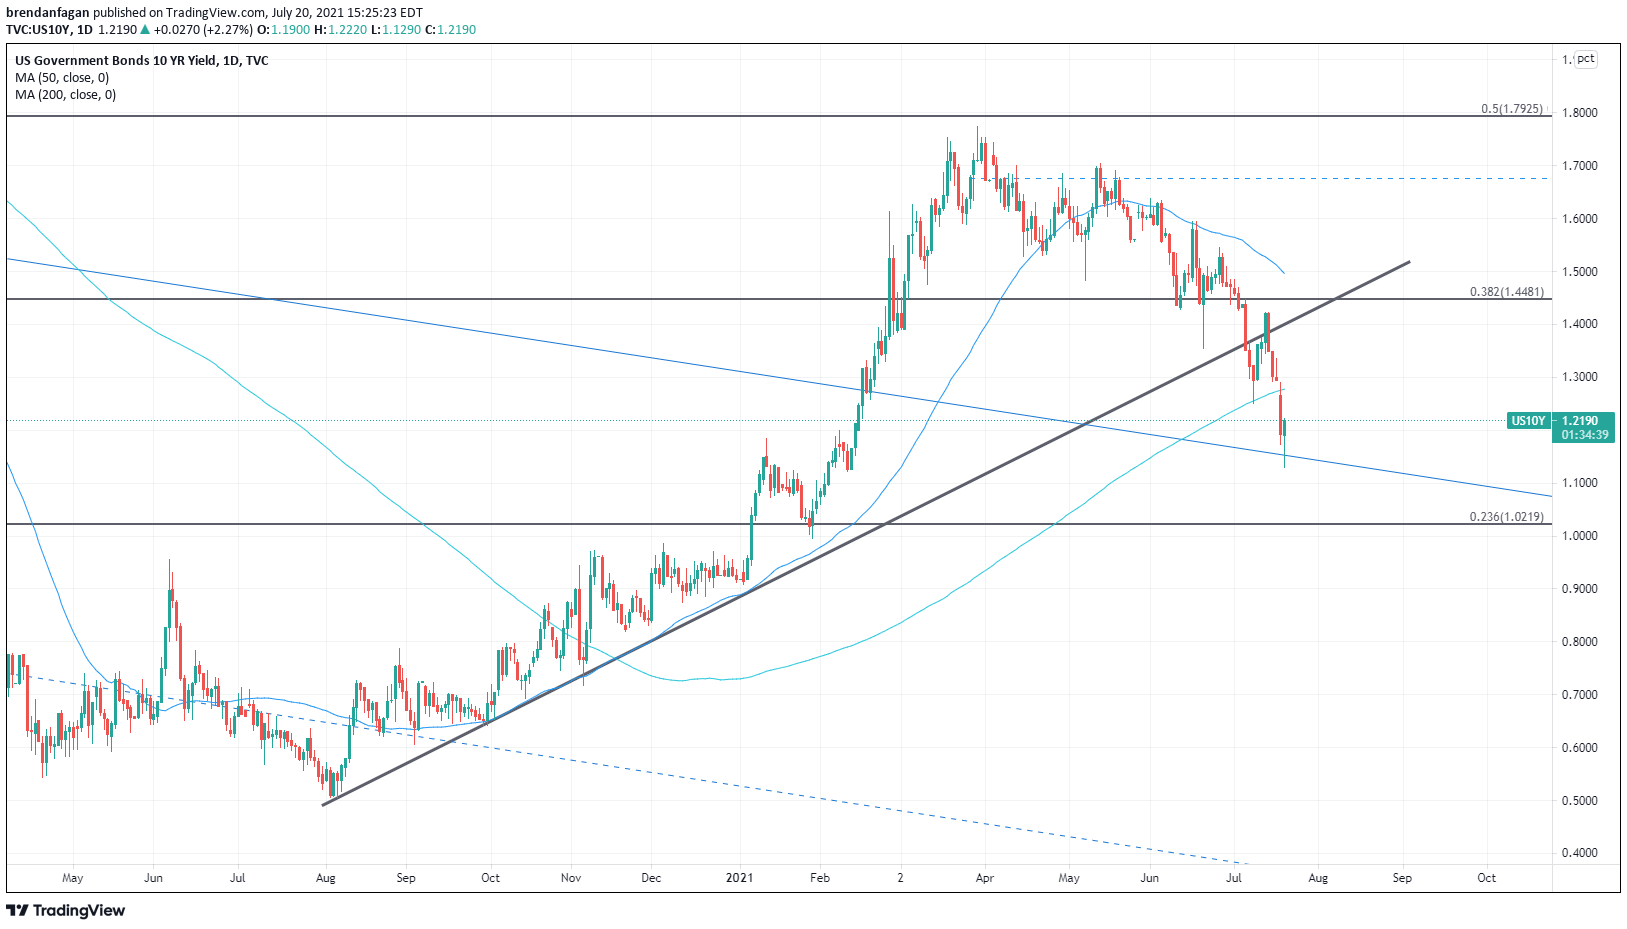
Chart provided by TradingView
--- Written by Brendan Fagan, Intern for DailyFX
To contact Brendan, use the comments section below or @BrendanFaganFX on Twitter


