


Nasdaq 100 Price Outlook:
- The Nasdaq 100 has declined from its record high near 15,000 as risk appetite recedes across the market
- Weeks of gains have equipped the tech-heavy index with a plethora of potential support to work with
- IBM, Netflix, Twitter Earnings Eyed as Nasdaq 100 Faces "Reality Check"
Nasdaq 100 Forecast: Stock Rout Sees Index Seek Trendline Support
The Nasdaq 100 is on the backfoot alongside other risk assets to start the week as covid delta variant concerns and seasonal headwinds work to erode risk appetite across global markets. While traditionally more volatile than the S&P 500 and Dow Jones, the Nasdaq 100 has seemingly reclaimed its almost defensive-like status during bouts of covid concern as losses in the other indices outpace that of the Nasdaq. Nevertheless, the Nasdaq 100 is more than 3.5% off its all-time high near 15,000 after breaking beneath trendline support.
Nasdaq 100 Price Chart: 4 - Hour Time Frame (February 2021 – July 2021)
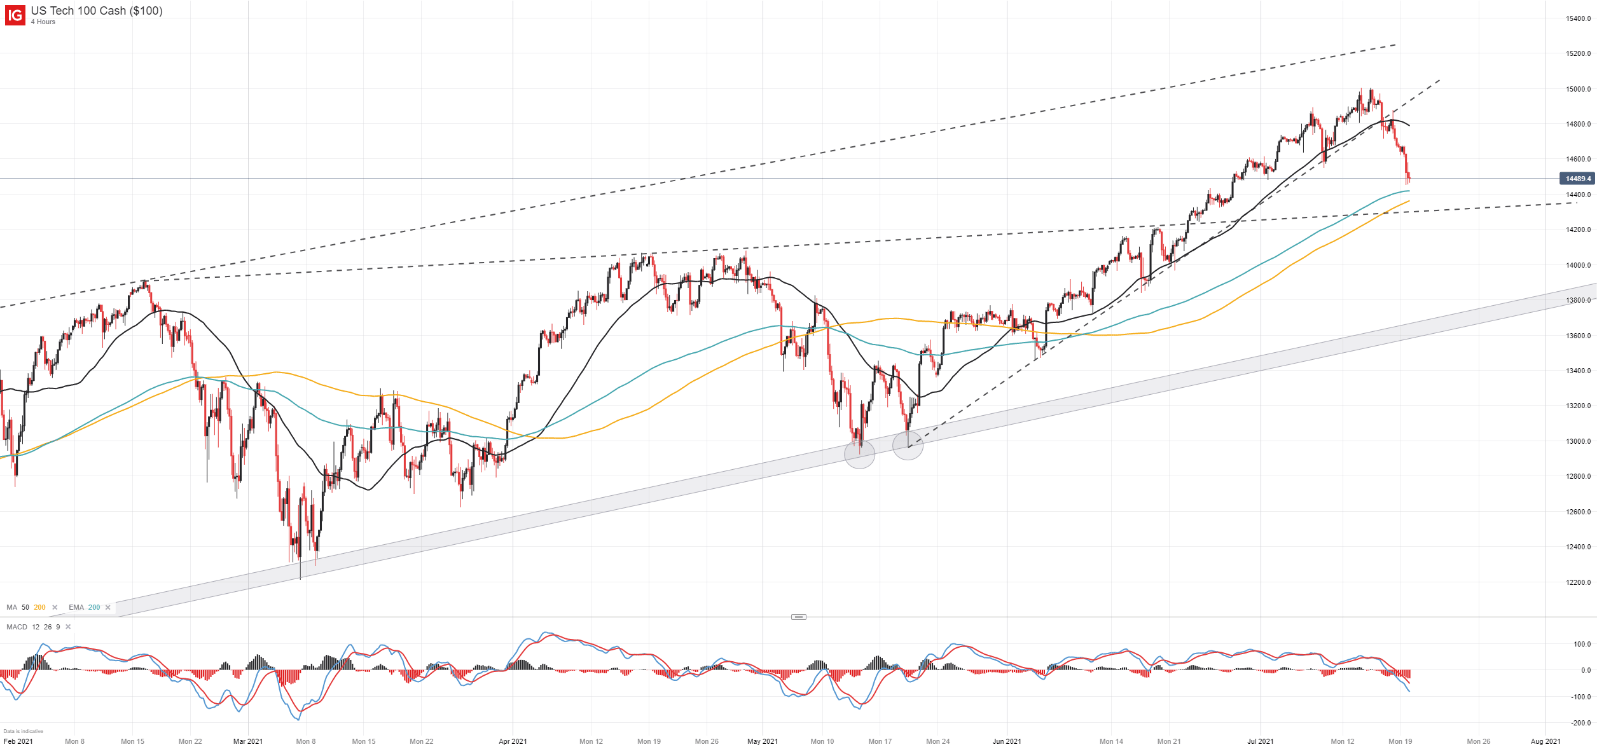
With losses mounting and weeks of gains beneath it, initial support may reside along an ascending trendline derived from the index’s February 2021 high. The level previously served as resistance until mid-June and has proved its technical influence in the past. Still, if price continues to fall any upcoming attack on the level will mark its first test. Should it fail, traders and investors might shift their focus to the more formidable rising channel near 13,000.
Nasdaq 100 Price Chart: Daily Time Frame (August 2020 – July 2021)

The channel coincides with various swing lows established over the last few months and may act as the “line in the sand” at this stage which, if broken, could open the door to significant losses. That said, the Nasdaq 100 has climbed higher for weeks nearly devoid of interruption so losses at theses levels may serve as healthy consolidation in the bigger picture as there is little to suggest the bull market will suddenly meet its end. In the meantime, follow @PeterHanksFX on Twitter for updates and analysis.

--Written by Peter Hanks, Strategist for DailyFX.com
Contact and follow Peter on Twitter @PeterHanksFX


