


NASDAQ 100, NIKKEI 225, ASX 200 INDEX OUTLOOK:
- Dow Jones, S&P 500 and Nasdaq 100 indexes closed +0.36%, +0.35% and +0.35% respectively
- Earnings optimism boosted equities, but will they face a “reality check” after release?
- China trade balance and US core inflation data are among the key event risks today

Earnings, US inflation, China Trade Balance, Nikkei 225 Rally, Asia-Pacific at Open:
Wall Street stocks marched higher into record territory on Monday as markets anticipated a strong Q2 earnings season ahead. The estimated earnings growth rate for the S&P 500 companies is expected at 64%, which will mark the fastest expansion in more than a decade. Earnings optimism helped to defy viral concerns and tapering fears, but it will also put stocks under a “reality check” when actual results are released.
The Nasdaq 100 index climbed 0.35%, lifted by large-cap stocks such as Tesla (+4.38%), ASML (+2.38%), NVIDIA (+2.31%) and Alphabet (+1.16%).
Daily Performance of Nasdaq 100 Top 10 Stocks – 12-07-2021
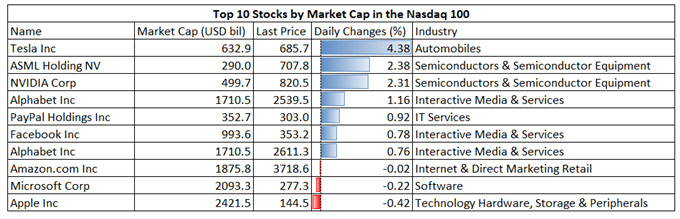
Source: Bloomberg, DailyFX
Looking ahead, today’s release of US core inflation data is among key market events. The core CPI reading is expected to hit 4.0% in June, a level not seen since 1992. An even higher reading may stoke inflation concerns and lead the US Dollar higher, weighing on equity markets. A lower reading may lead to the opposite.
Meanwhile, Chinese trade balance data will be monitored by APAC investors for clues about the health of the world’s second-largest economy. Export growth in USD terms is expected to moderate to 23.1% from May’s 27.9%, partially due to the lapse of a low base-effect. The recent RRR cut by the PBoC underscored slowing growth momentum and the need for liquidity for small and medium enterprises as rising raw material prices squeezed their profit margins. Weaker-than-expected export growth in June may strengthen this prospect.
US Core Inflation - Expectations
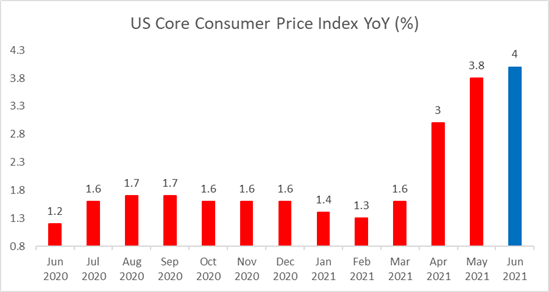
Source: Bloomberg, DailyFX
Asia-Pacific markets look set to trade higher on Tuesday. Futures in Japan, mainland China, Australia, Hong Kong, South Korea, Taiwan, Singapore and India are in the green, whereas those in Malaysia and Thailand are in the red.
Japan’s Nikkei 225 index surged 2.25% on Monday and extended higher this morning. Investor confidence was revived after Yaskawa Electric – a robot marker seen as a leading indicator on Japanese manufacturer sector – raised its operating profit forecast by 29%. Its share price jumped 6.47% on Monday. Japan’s machinery orders climbed for a third month in May, underscoring a smooth recovery in the industrial and electric machinery sectors.

Nasdaq 100 IndexTechnical Analysis
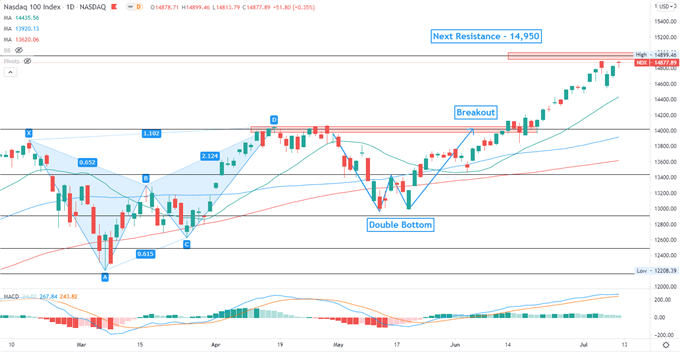
The Nasdaq 100 index is attempting to challenge a key resistance level at 14,950 – the 261.8% Fibonacci extension. A successful try would likely intensify near-term buying pressure and open the door for further upside potential. A failed attempt however, may lead to a pull back towards the 20-day SMA line for support. The MACD indicator is flattening amid an uptrend, suggesting that prices may be temporarily overbought and vulnerable to a technical pullback.
Nasdaq 100 Index– Daily Chart
Nikkei 225 Index Technical Analysis:
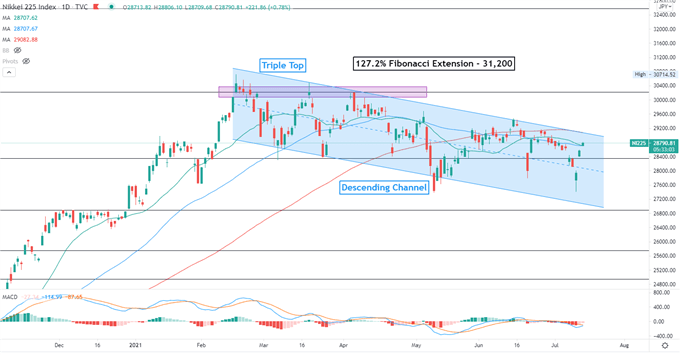
The Nikkei 225 index remains in a “Descending Channel” formed since February. The floor and ceiling of the channel may be viewed as immediate support and resistance levels respectively. The overall trend remains bearish-biased as suggested by the downward-sloped SMA lines. The MACD indicator is oscillating at around the neutral line, suggesting that prices may be lack of a clear direction.
Nikkei 225 Index – Daily Chart
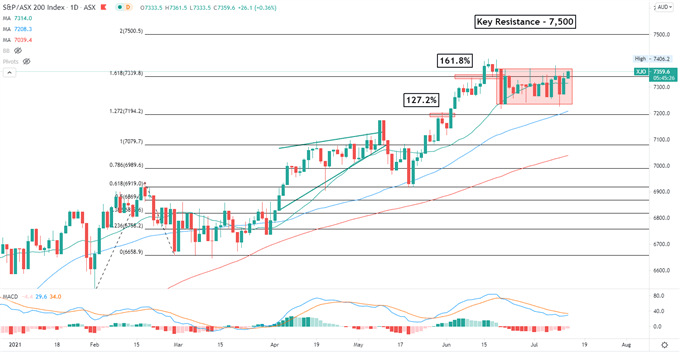
ASX 200 Index Technical Analysis:
The ASX 200 index entered a tight range between 7,230-7,370 over the past few weeks, waiting for fresh catalyst for a breakout. The overall bullish trend remains intact as suggested by the upward-sloped SMA lines. The MACD indicator is about to form a bullish crossover, suggesting that upward momentum may be building.
ASX 200 Index – Daily Chart

--- Written by Margaret Yang, Strategist for DailyFX.com
To contact Margaret, use the Comments section below or @margaretyjy on Twitter


