


FTSE Analysis:
- The FTSE started the week lower as energy and mining stocks decline on softer commodity prices
- FTSE continues to trade near the middle of the broad channel in search of directional clues – UK inflation data on Wednesday
- IG Client Sentiment provides a bearish bias as traders increase longs, exit shorts

FTSE Opens Lower as Commodities take a Breather
The FTSE 100 index started the week on the back foot as softer commodity prices resulted in declines in Antofogasta, Anglo American and Glencore. The index’s biggest mover in early trade was Admiral Group which reported higher than expected H2 profitability as a result of lower claims through the lockdown period.
Main risk events this week focuses on UK inflation as we head into what is likely to be the last week of lockdown for the UK.
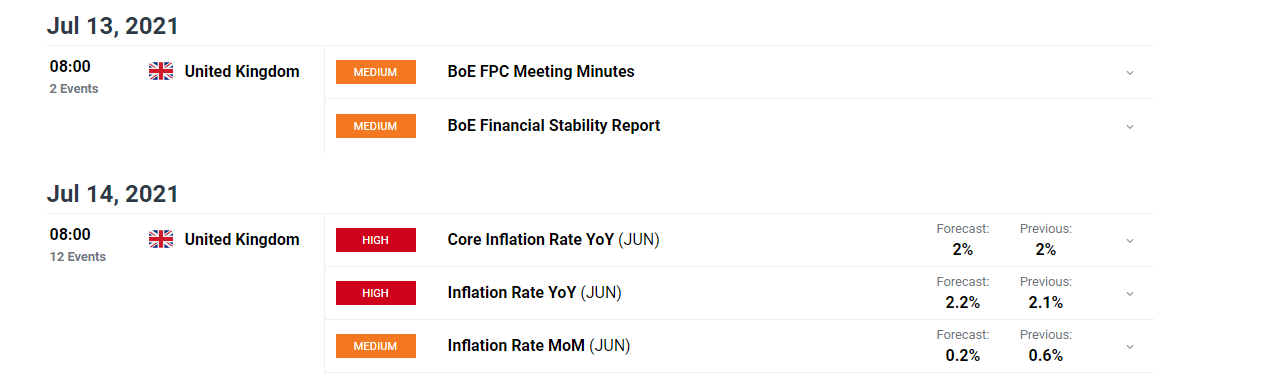
For all market-moving data releases and events see the DailyFX Economic Calendar
Key Technical Levels for FTSE
The daily chart shows the broad trading range (7000 – 7170) that has encased much of the FTSE’s price action over the last two months. The range seems to have appeared as a result of slowing bullish momentum as can be seen by the lower trending MACD indicator. Adding to this is the negative divergence as the index printed higher highs while the MACD exhibited lower highs.
FTSE Daily Chart
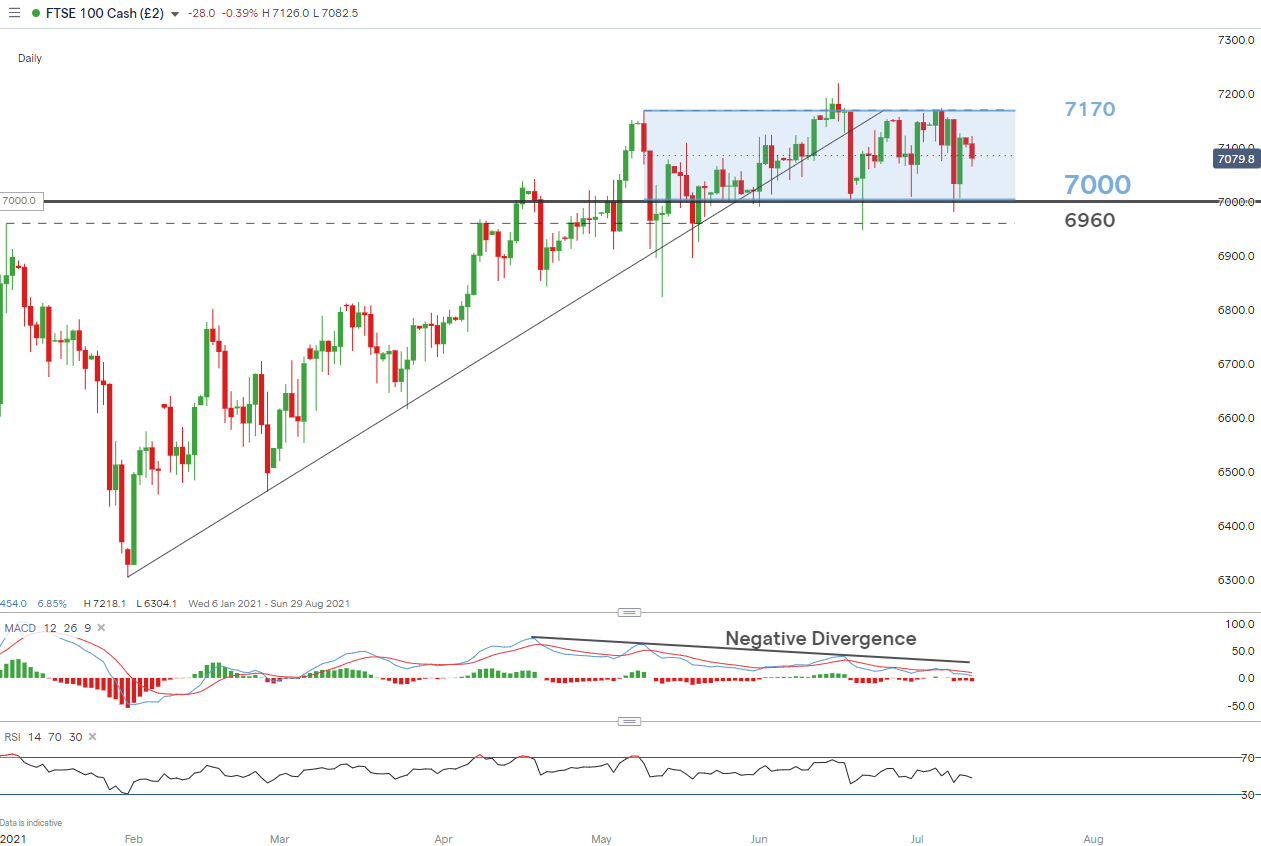
Chart prepared by Richard Snow, IG
Taking a closer look at the 4-hour chart, price action trades around the middle of the trading range. Traders will be looking for clues on possible directional moves with the help of nearby levels of support and resistance. A move above the 7110 – 7160 resistance zone and short term descending trendline would be of interest to FTSE bulls, while a break below 7065 could interest bears in a potential move towards the lower end of the range.

FTSE 4 hour chart
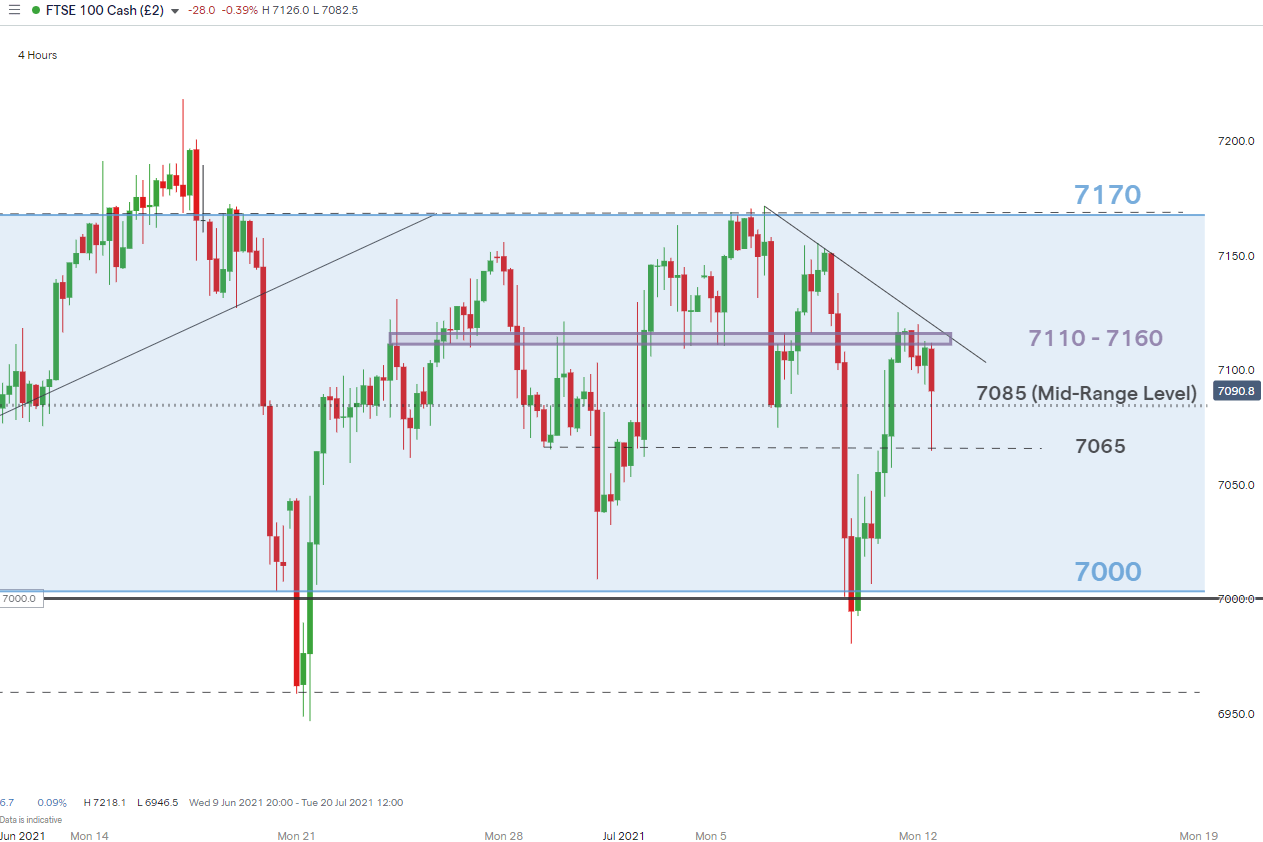
Chart prepared by Richard Snow, IG
Contrarian Indicator Hints at Lower FTSE Move
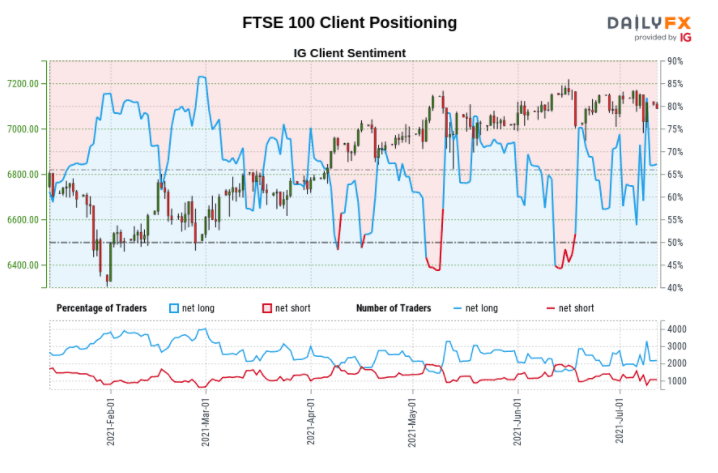
FTSE 100: Retail trader data shows 67.34% of traders are net-long with the ratio of traders long to short at 2.06 to 1.
We typically take a contrarian view to crowd sentiment, and the fact traders are net-long suggests FTSE 100 prices may continue to fall.
The number of traders net-long is 1.60% higher than yesterday and 12.32% higher from last week, while the number of traders net-short is 0.09% lower than yesterday and 9.82% lower from last week.
Traders are further net-long than yesterday and last week, and the combination of current sentiment and recent changes gives us a stronger FTSE 100-bearish contrarian trading bias.
| Change in | Longs | Shorts | OI |
| Daily | -30% | 25% | 2% |
| Weekly | -44% | 44% | 0% |
--- Written by Richard Snow for DailyFX.com
Contact and follow Richard on Twitter: @RichardSnowFX


