S&P 500 PRICE OUTLOOK: STOCK MARKET PULLS BACK FROM RECORD HIGH
- Stocks are reversing hard from all-time highs with S&P 500 price action down over -1%
- The S&P 500 Index is attempting to find confluent support around the 4,300-price level
- Eyes on Fibonacci retracements, the 14 June high, rising trendline, and MACD crossover


S&P 500 price action took a nasty tumble at the New York opening bell on Thursday. Stocks slid across the board as the VIX ‘fear-gauge’ exploded higher. All major stock indices are trading in the red and down around -1% on the session.
The move is corresponding with an extended plunge in bond yields with the ten-year Treasury nosediving over 15-basis points since Monday to 1.3%. As such, it seems equity investors are finally catching on to the fears of slowing economic growth being reflected in the bond market.
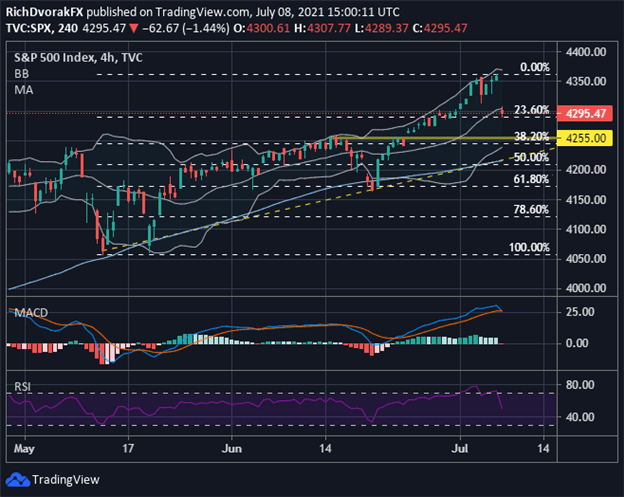
Since Wall Street came online, however, the S&P 500 Index has chopped around the psychologically-significant 4,300-price level. This area of confluent support is underpinned by the 23.6% Fibonacci retracement level of the S&P 500’s trading range from 12 May to 07 July.
SPX – S&P 500 INDEX PRICE CHART: 4-HOUR TIME FRAME (30 APRIL TO 08 JULY 2021)

Chart by @RichDvorakFX created using TradingView
Maintaining altitude here could encourage S&P 500 bulls to close the gap lower from this morning’s open. Although, if selling pressure resumes and the 4,300-handle is breached, traders might look to defend support underpinned by the 14 June high and 4,255-price level.
| Change in | Longs | Shorts | OI |
| Daily | 1% | -1% | 0% |
| Weekly | 15% | -13% | -1% |
Sustained downward pressure could see a bearish MACD crossover materialize as hinted at on the 4-hour chart above. This might bring the ascending trendline and 50-day simple moving average into focus as subsequent technical barriers with potential of helping keep S&P 500 price action afloat.
-- Written by Rich Dvorak, Analyst for DailyFX.com
Connect with @RichDvorakFX on Twitter for real-time market insight


