


Dow Jones, Crude Oil, Energy Stocks, OPEC+, ISM Prices Paid, ASX 200 – Asia Pacific Indices Briefing
- Dow Jones, S&P 500 and Nasdaq Composite gain to start July
- Energy stocks, crude oil prices rise on OPEC+ deal struggle
- ASX 200 vulnerable, traders await key US non-farm payrolls

Thursday’s Wall Street Trading Session Recap
Stocks on Wall Street traded mostly higher on Thursday, with the Dow Jones, S&P 500 and tech-heavy Nasdaq Composite rising 0.38%, 0.52% and 0.13% respectively. Investors were back to favoring the rotation trade into value equities from growth ones. This also follows economic data that continued to highlight rising price pressures that the United States, and parts of the world, are facing.
While ISM manufacturing disappointed, clocking in at 60.6 versus 60.9 expected, prices paid rose to 92.1 compared to 87.0 estimated and 88.0 prior. Readings above 50 indicate expansion in the segment while those below 50 mark contraction. The gauge of prices paid for raw materials hit its highest since 1979, likely placing more pressure on the Federal Reserve to consider tapering monetary policy sooner than anticipated.
Energy stocks were a particular outperformer over the past 24 hours, driven by rising crude oil prices after a lack of progress in talks during an OPEC+ meeting. An output hike of about 400k barrels per day is now in question after the United Arab Emirates objected to the measure. As such, members pushed back the meeting to Friday, casting doubt over whether or not an agreement could be reached, creating supply constraint woes.

Dow Jones Technical Analysis
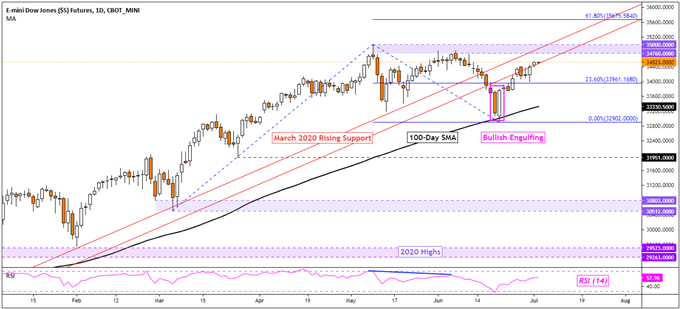
The Dow Jones continues its bounce from earlier this month when a Bullish Engulfing emerged, hinting at further gains. The 100-day Simple Moving Average (SMA) is also acting as key support after a false breakout under a rising trendline from March 2020. As such, this is placing the focus on the key 34760 – 35000 resistance zone as it looms ahead.
Dow Jones – Daily Chart
Friday’s Asia Pacific Trading Session
With that in mind, Asia-Pacific benchmark equities could find themselves echoing the rosy mood set on Wall Street as the week wraps up. The economic docket is fairly light, likely leaving market mood as the key driver ahead. There may be some consolidation as traders await the next US non-farm payrolls report, due after APAC indices close for trading.
A better-than-expected outcome, particularly from average hourly earnings, could add fuel to expectations that the Fed could taper asset purchases sooner. That could bode ill for general market sentiment, particularly growth-oriented sectors such as tech. In the meantime, Australia’s ASX 200 is also looking vulnerable amid rising cases of the Delta Covid variant and temporary lockdowns in parts of the country.

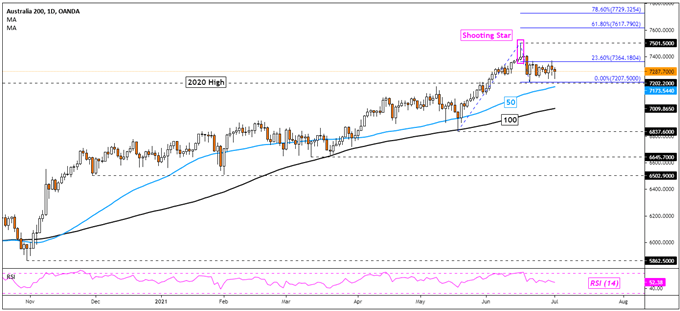
ASX 200 Technical Analysis
The ASX 200 continues to consolidate in the aftermath of a Shooting Star candlestick pattern. Still, the 50-day and 100-day SMAs continue to paint a dominant upside bias despite the potential for a near-term pullback. Bouncing off support from here could place the focus back towards the all-time high. Otherwise, clearing the 50-day SMA may open the door to testing the 100-day equivalent.
ASX 200 – Daily Chart
--- Written by Daniel Dubrovsky, Strategist for DailyFX.com
To contact Daniel, use the comments section below or @ddubrovskyFX on Twitter


