
Gold (XAU/USD) Analysis, Price, and Chart
- Fibonacci support may be tested again.
- Traders cover net-shorts over the week as the market crumbles.

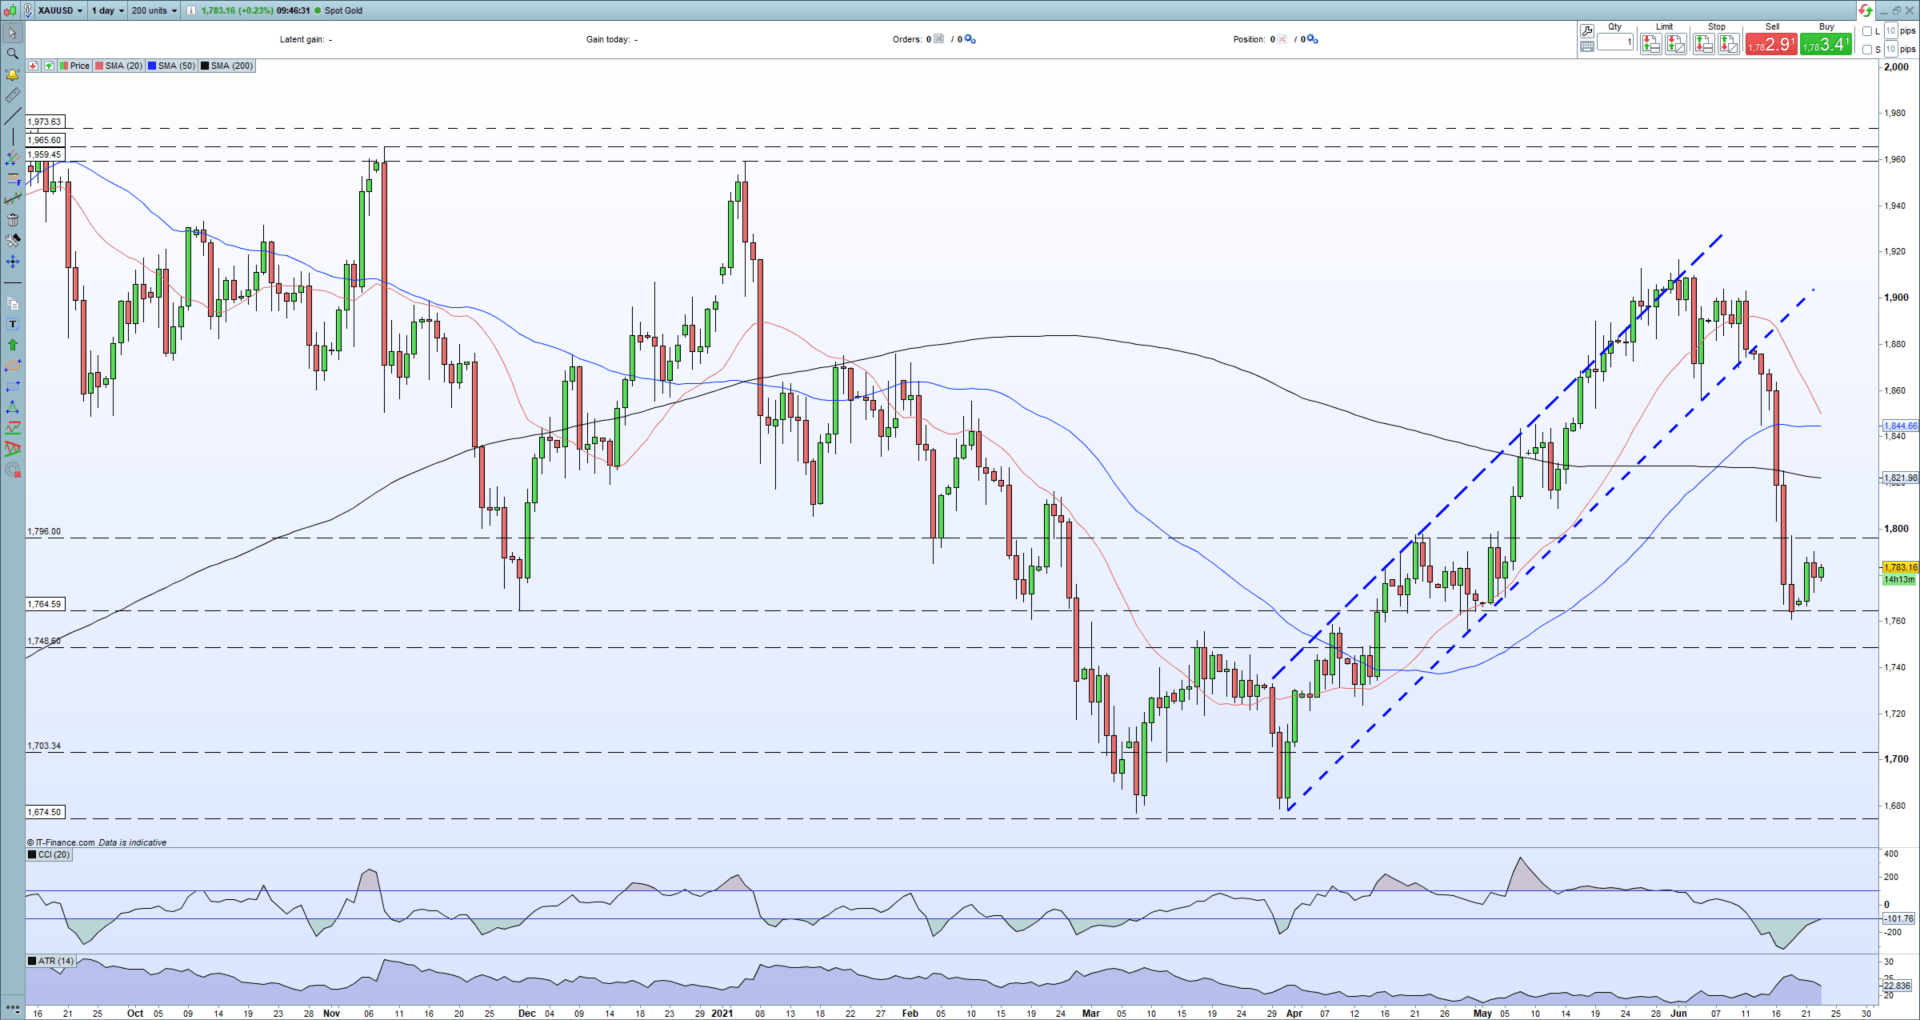
The medium-term bullish uptrend was broken with ease 10 days ago and gold now finds itself close to an important support level that needs to hold if the precious metal is to move higher. The 50% Fibonacci retracement of the mid-March/early-August 2020 rally comes in around $1,764/oz. a level that held its first real test last Friday. Initial resistance looks likely around the psychological $1,800/oz. level and from some prior high prints.
The rest of this week brings further commentary from a range of Fed speakers along with the latest look at US inflation, durable goods orders, and Michigan consumer sentiment. The core PCE release, the Fed’s favoured inflation reading, is released on Friday and is expected to show that inflation rose to 3.4% in May, from 3.1% in April, a number that will add weight to fears that price pressures in the US are far from transitory. A further move higher in the US dollar on growing inflation fears will add more downside pressure on gold.
For all market-moving news and data releases, see the DailyFX Economic Calendar
Gold Daily Price Chart (November 2020 – June 23, 2021)
| Change in | Longs | Shorts | OI |
| Daily | -3% | 0% | -2% |
| Weekly | 6% | -9% | -2% |
Client sentiment data show 86.41% of traders are net-long with the ratio of traders long to short at 6.36 to 1. The number of traders net-long is 0.80% higher than yesterday and 18.56% higher from last week, while the number of traders net-short is 3.64% higher than yesterday and 46.05% lower from last week.
We typically take a contrarian view to crowd sentiment, and the fact traders are net-long suggests Gold prices may continue to fall.Positioning is less net-long than yesterday but more net-long from last week. The combination of current sentiment and recent changes gives us a further mixed Gold trading bias.
What is Market Sentiment and How Does it Work?
What is your view on Gold – are you bullish or bearish?? You can let us know via the form at the end of this piece or you can contact the author via Twitter @nickcawley1.