


Gold, Silver, Copper – Talking Points
- Gold pulls back as Fed’s Brainard hints at possible upcoming taper talks
- Silver follows gold as markets shift focus to May’s US Non-farm Payrolls
- Copper looks to find support after breaking above triangle resistance

Gold prices fell back below the 1,900 level after the yellow metal’s strength cooled on better-than-expected US ISM manufacturing data on Wednesday morning. According to the DailyFX Economic Calendar, the May PMI data from ISM hit 61.2, beating the consensus forecast of 60.9. The upbeat economic data fueled Fed taper talk speculation, which has been an ongoing speculative debate among market participants.
Lael Brainard, Federal Reserve Board of Governors member, spoke from the Economic Club of New York on Tuesday when she supported the ongoing super-lose monetary policy in place. However, Ms. Brainard made a shift in her language this week – replacing “patient” to “steady" when referring to the Fed’s course of action -- perhaps a sign that she may now be more perceptive to a rollback in the Fed’s balance sheet.
XAU/USD’s technical position appears fragile despite pushing into fresh multi-month highs. The psychologically imposing 1,900 level appears to be a point of contention for the yellow metal. The quick surrender back below 1,900 suggests fading upward momentum. Still, the pullback is rather modest, and a bullish SMA crossover between the 50- and 100-day Simple Moving Averages may indicate possible upside. The Relative Strength Index (RSI) and MACD both indicate a deeper pullback may be on the cards, however.
Gold Daily Price Chart
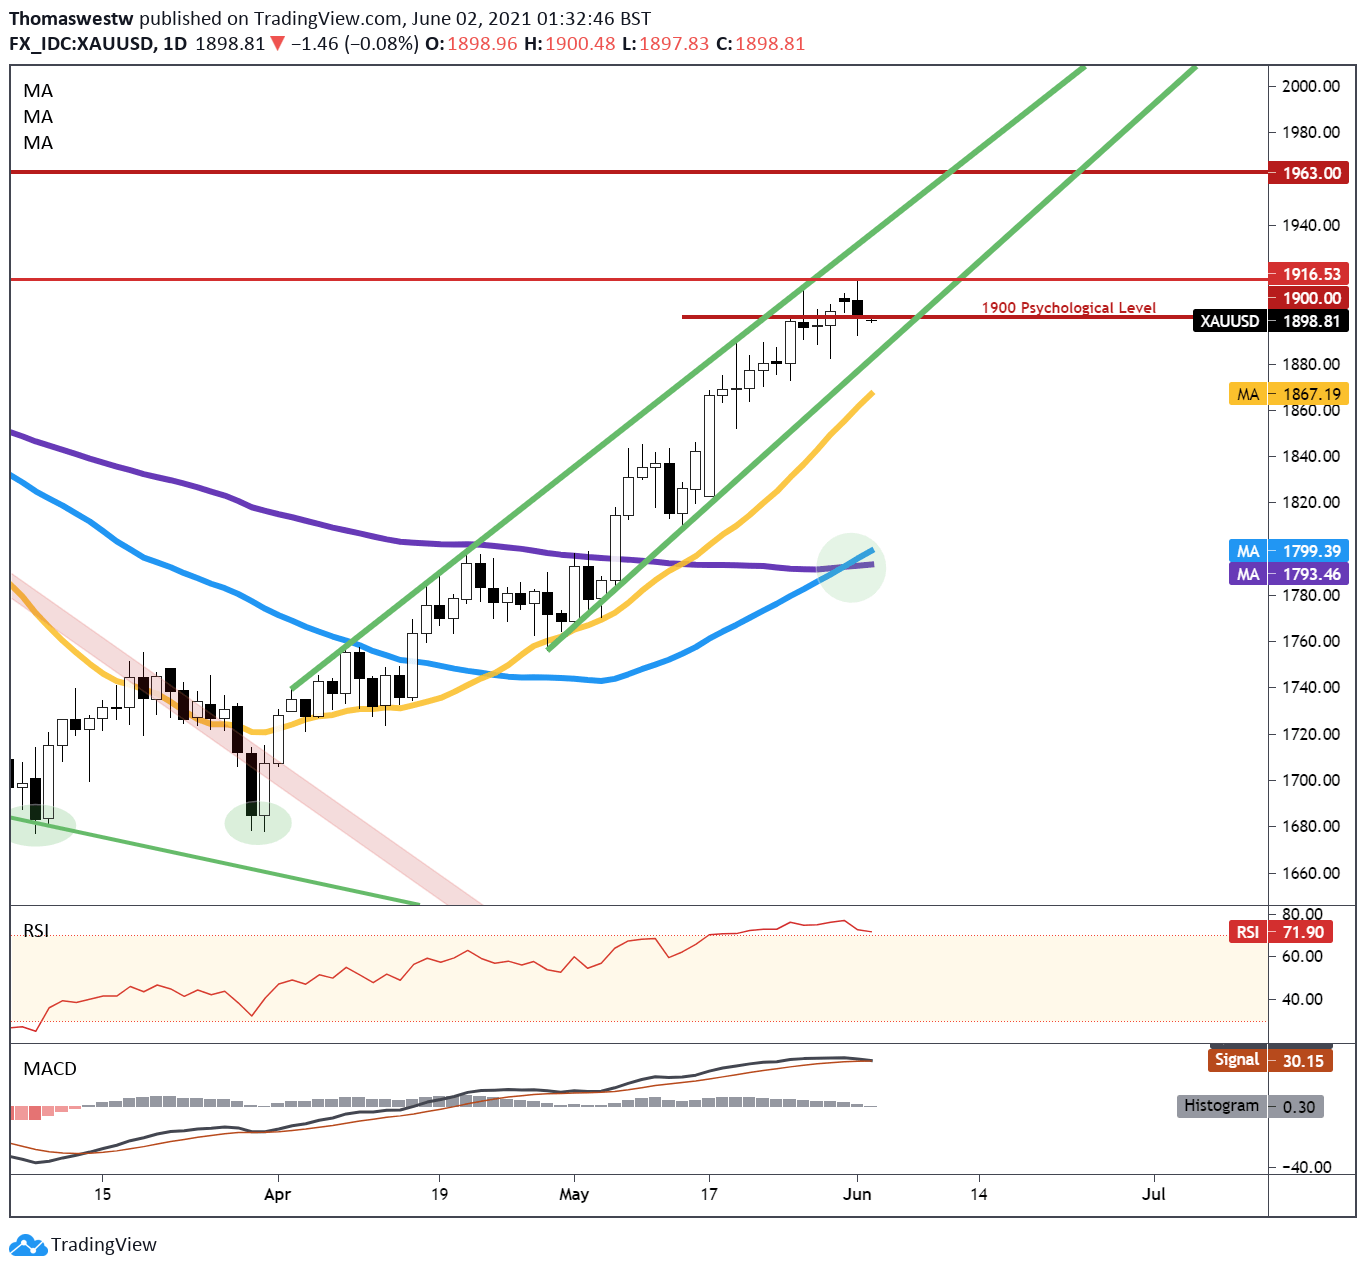
Chart created with TradingView

Elsewhere, silver also saw a pullback versus the US Dollar, with XAG/USD moving below the 28 handle. The precious metal remains near multi-month highs despite the modest pullback to start the month. Since the March low, prices have climbed over 17%, helped by a weakening US Dollar. As with gold prices, silver retreated modestly following the ISM manufacturing print, which boosted bets for balance sheet tapering.
XAG/USD’s technical position improved dramatically through April and May trading, gaining 6.14% and 8.21%, respectively. The August 2020 multi-year high at 28.11 appears to be imposing significant resistance on the precious metal. Clearing that level is key to break into higher ground. Support from an upward channel stemming from the March swing low may help foster that push, but a break below support may drop price to the rising 50- or 100-day SMA.
Silver Daily Chart
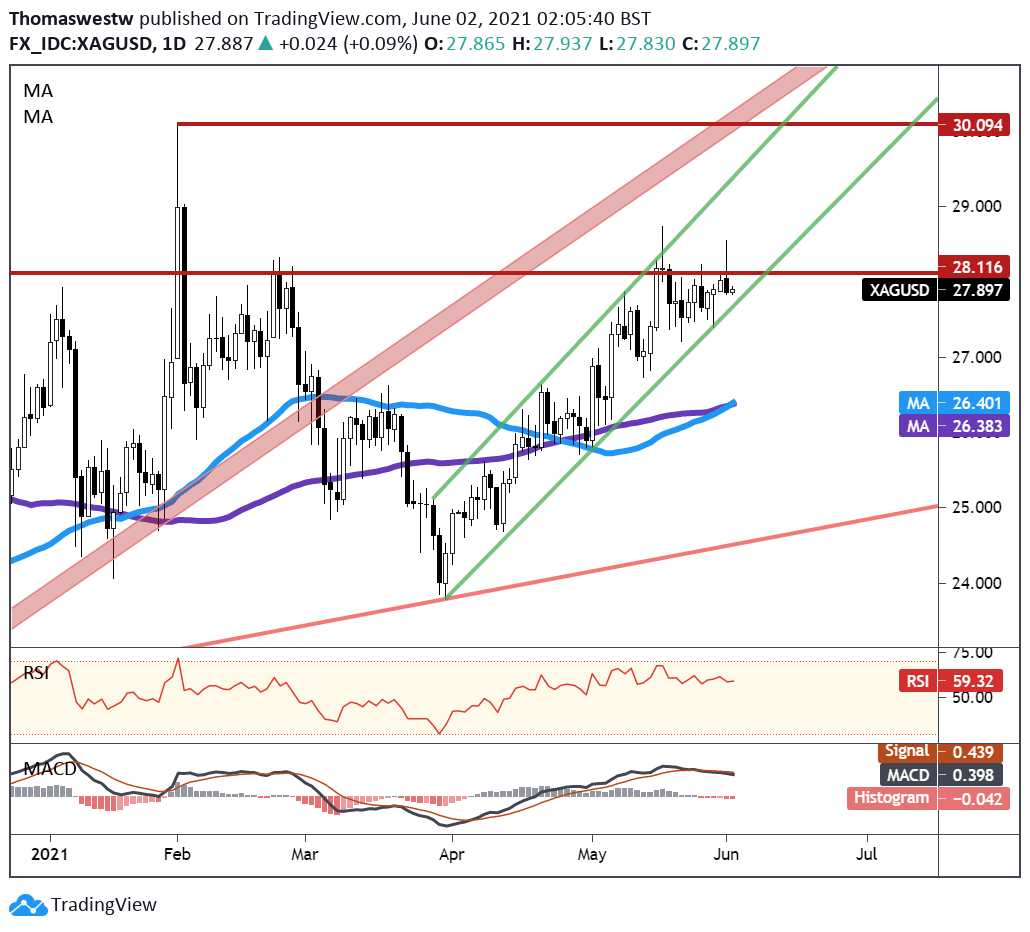
Chart created with TradingView
Copper is coming off two months of bullish action, breaking 11.83% and 4.69% higher, respectively. Like gold and silver, the US Dollar’s decline helped advance the industrial metal. Actions out of China to cull speculation in the high-flying metals market have had limited success outside of a few road bumps in price action. The global economic reopening has proved to be the main price driver as demand continues to accelerate while pandemic-induced supply bottlenecks are ironed out.
Copper has pushed above a Descending Triangle’s downward trendline, but so far, price has failed to see significant upside movement. The price appears to be moving lower, which could see the prior resistance level step in as support. If so, it may inject confidence for traders to take price higher. If a move lower forms, however, the rising 50-day SMA could step in to provide support as it has earlier this year. The 4.88 level is the upside target before breaking into fresh highs.
Copper Daily Chart
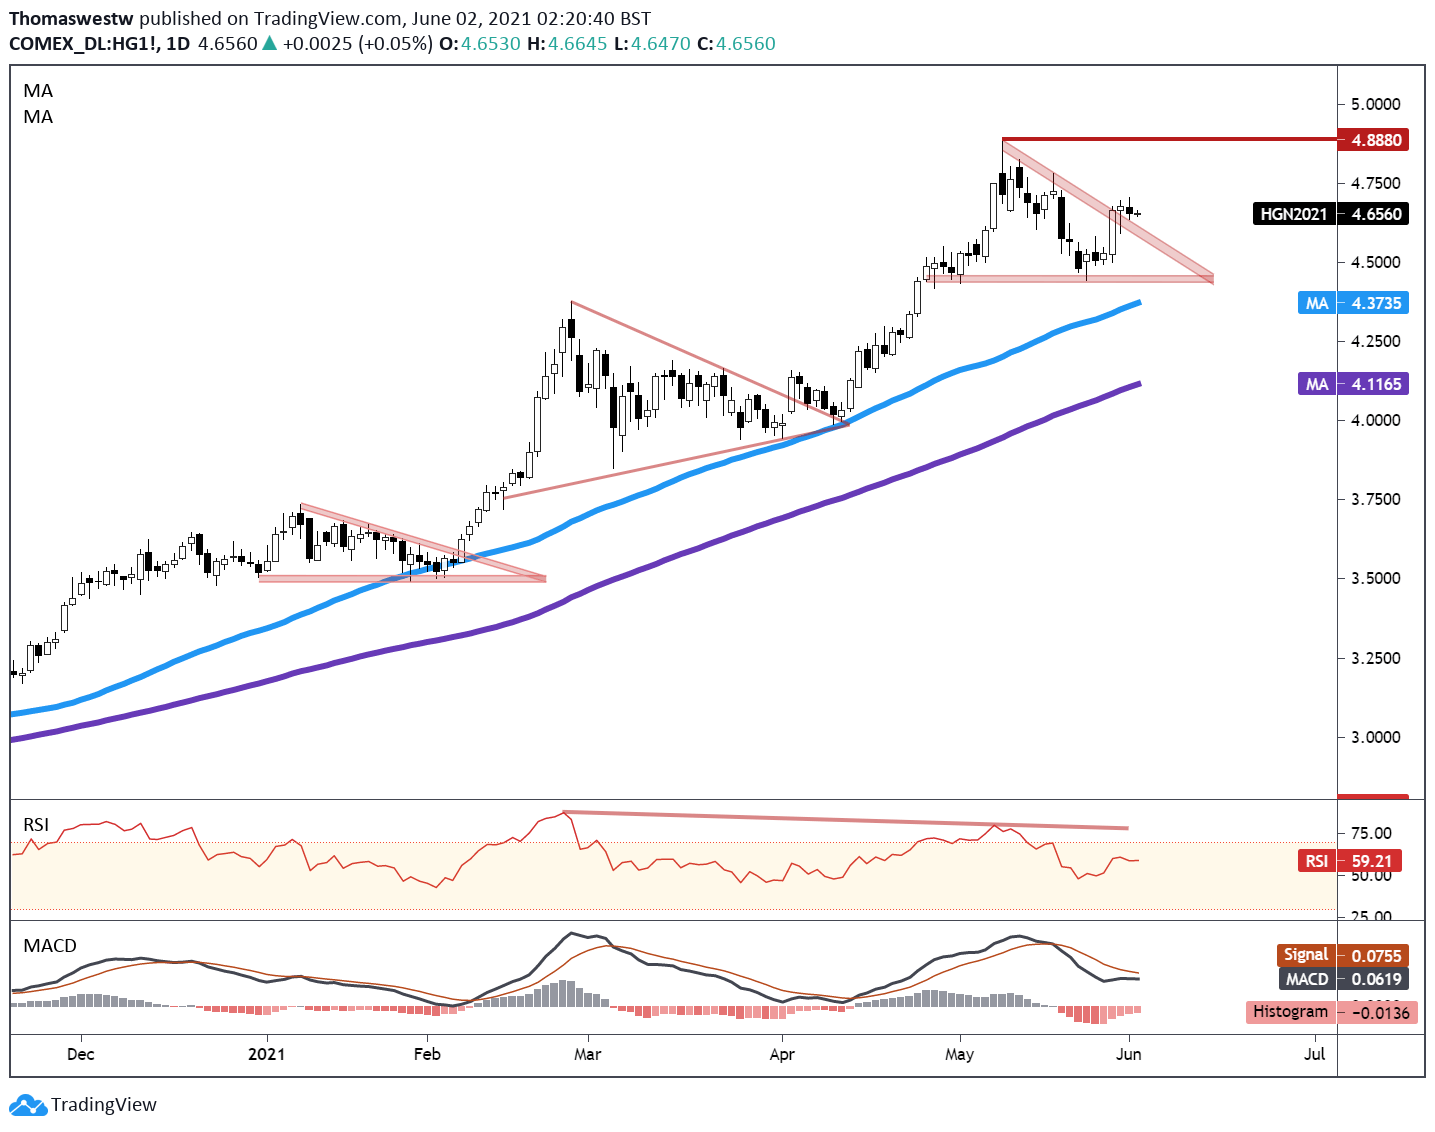
Chart created with TradingView


