


CAD price, news and analysis:
- USD/CAD looks ready to resume its previous decline after relative stability in the pair over the past seven days.
- Long-term, it could even fall to the 1.2062 low recorded in September 2017, with CAD boosted by the likelihood of further strength in crude oil prices.
USD/CAD outlook: further losses likely
USD/CAD has traded in a relatively narrow range between 1.2351 and 1.2252 since Thursday last week but now looks well placed to resume its previous decline that took it from almost 1.34 in late October last year down to current levels.
Looking at the chart below, the recent stability looks like a period of consolidation that could well be followed by falls that could reach as far as the 1.2062 low recorded in September 2017 that looks now like a reasonable long-term target for the pair.
USD/CAD Price Chart, Daily Timeframe (October 21, 2020 – May 6, 2021)
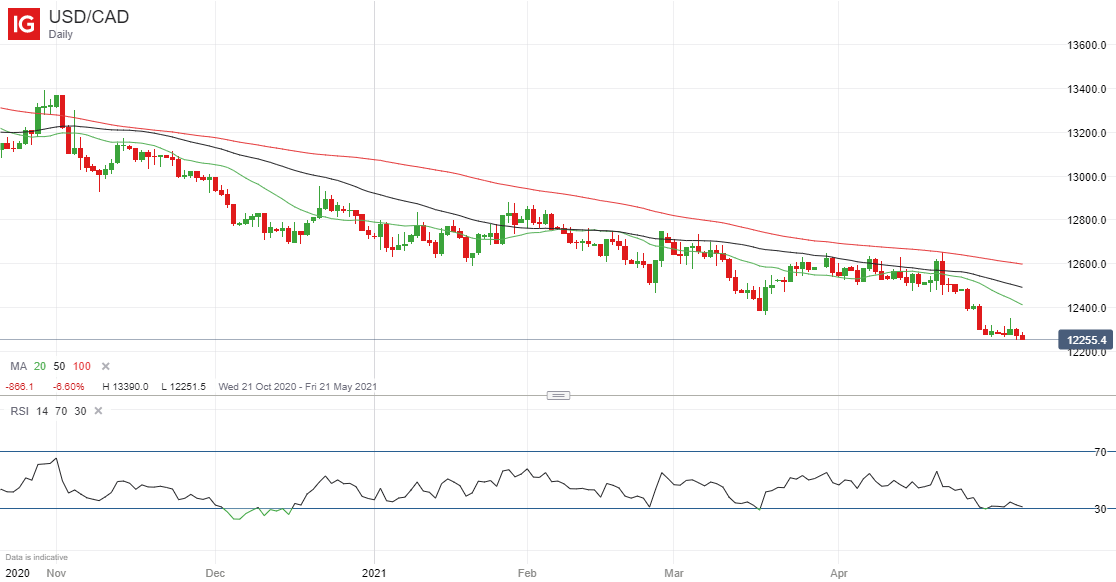
Source: IG (You can click on it for a larger image)
| Change in | Longs | Shorts | OI |
| Daily | -2% | 7% | 5% |
| Weekly | -30% | 38% | 13% |
Behind the strength of the Canadian Dollar lies the advance in crude oil prices, which have benefited from higher demand – along with commodities such copper, iron ore and aluminum – as the global economy recovers after the downturn caused by the coronavirus pandemic. Oil is Canada’s largest export by some distance.
As the next chart shows, the price of US crude has popped higher from a symmetrical triangle continuation pattern that can be thought of as signaling a resumption of the prior trend higher.
US Crude Oil Price Chart, Daily Timeframe (October 16, 2020 – May 6, 2021)
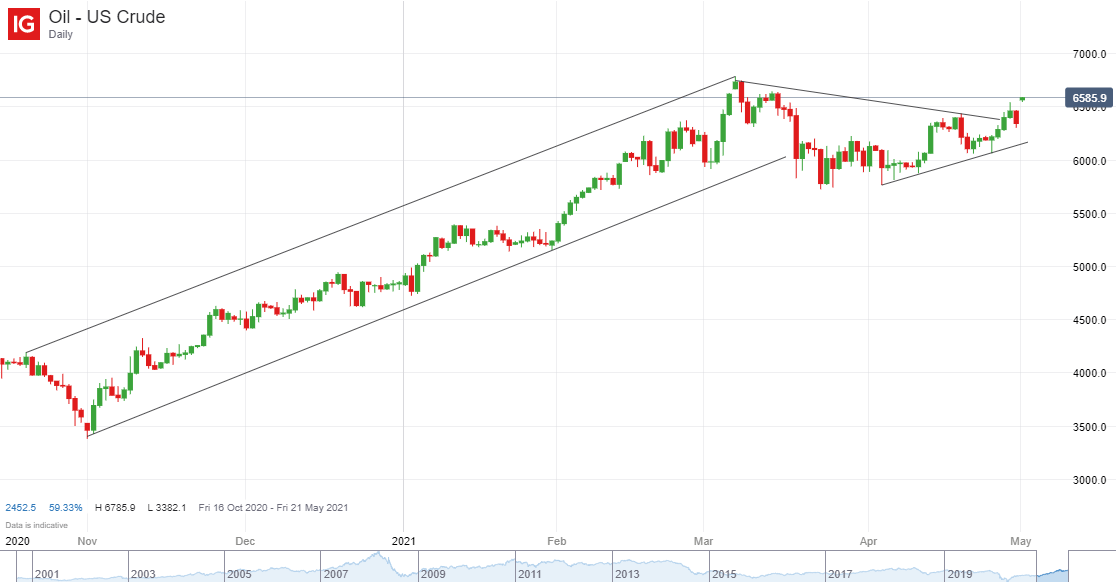
Source: IG
| Change in | Longs | Shorts | OI |
| Daily | 3% | -7% | 1% |
| Weekly | 31% | -38% | 7% |
--- Written by Martin Essex, Analyst
Feel free to contact me on Twitter @MartinSEssex


