


S&P 500, NIKKEI 225, ASX 200 INDEX OUTLOOK:
- Dow Jones, S&P 500 and Nasdaq 100 closed -0.36%, -0.53%, and -0.96% respectively
- The technology sector suffered a technical pullback despite strong earnings from IBM
- The Nikkei 225 and ASX 200 indexes opened amid a sour mood

Tech Pullback, Earnings, US Dollar, Asia-Pacific at Open:
Stocks on Wall Street pulled back from record highs as investors took some profit ahead of the peak of the earnings season. Nearly half of S&P 500 companies are going to release their Q1 results this and next week, including the majority of the FAANG names. Strong earnings growth has likely been baked into the lofty valuation of all three major indexes, rendering them vulnerable to a technical correction should there be a slight miss.
IBM has beaten both earnings and revenue expectations, and its share price is trading 4% higher during after-market hours. The company posted its first revenue growth in five quarters, paving the way for achieving revenue growth for the full year.
The DXY US Dollar Index fell 0.58% to 91.08 – a level not seen in more than six weeks. A seemingly widening trade deficit appears to be driving the Greenback lower as ports at California saw surging import activities. The Fed’s latest dovish stance may have also contributed to the weakness of the currency despite strong macro data released recently. A weaker US Dollar may strengthen the outlook of the Emerging Market currencies, precious metals and other commodities.
DXY US Dollar Index
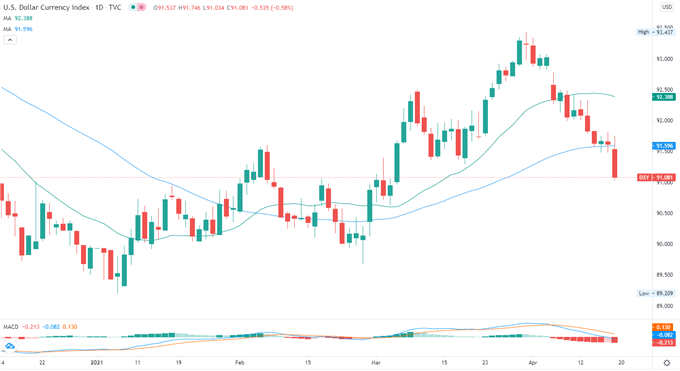
Chart by TradingView
Asia-Pacific markets are in a sour mood, with futures across Japan, Australia and Hong Kong pointing to open lower. Information technology and consumer discretionary sectors may suffer the largest pullback in those markets following trading patterns in the US overnight. Australia’s ASX 200 index looks set to retreat from a 14-month high.
Japan’s Nikkei 225 index entered a consolidative mood in early April and has been trading beneath the 30,000 mark since. The index was weighed by a supply shortage of semiconductors for the auto sector, rising Covid-19 infections and slow vaccination progress domestically as well as a strengthening currency. The Japanese Yen gained 2.3% against the US Dollar month-to-date, rendering the price of Japanese exports less competitive compared to before.
Looking ahead, UK unemployment changes headlines the economic docket alongside the interest rate decision from Bank Indonesia. Find out more from the DailyFX calendar.
Looking back to Monday’s close, 10 out of 11 S&P 500 sectors ended lower, with 66.9% of the index’s constituents closing in the red. Consumer discretionary (-1.14%) and information technology (-0.88%) were among the worst performers, whereas real estate (+0.29%) registered a small gain.
S&P 500 Sector Performance 19-04-2021
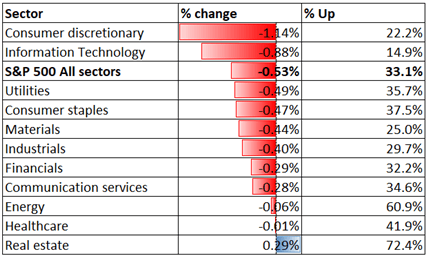
Source: Bloomberg, DailyFX

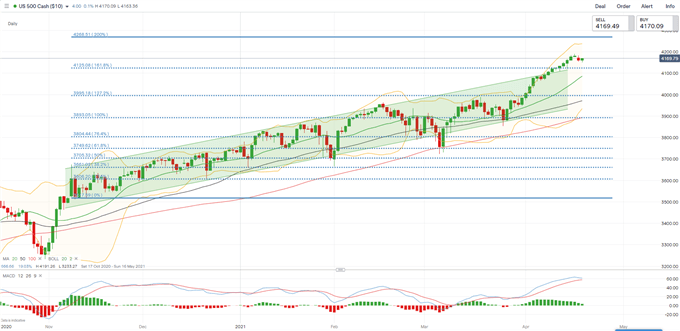
S&P 500 Index Technical Analysis
The S&P 500 index retreated from its record high overnight, possibly kicking off a technical pullback. Prices have breached above the 161.8% Fibonacci extension level (4,125) previously, which now becomes an immediate support. The overall trend remains bullish-biased as suggested by the upward-sloped moving averages. The MACD indicator is about to form a bearish crossover, suggesting that upward momentum may be fading.
S&P 500 Index – Daily Chart
Nikkei 225 Index Technical Analysis:
The Nikkei 225 index entered a consolidative phase after it failed to breach the 30,214 resistance (the 127.2% Fibonacci extension) for a third attempt. Immediate support levels can be found at 29,540 (50-day SMA) and then 28,357 (100% Fibonacci extension). The MACD indicator is trending lower, suggesting that further consolidation is likely.
Nikkei 225 Index – Daily Chart
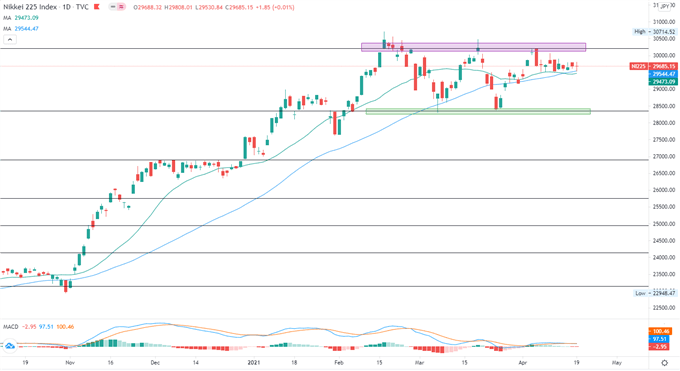
Chart by TradingView
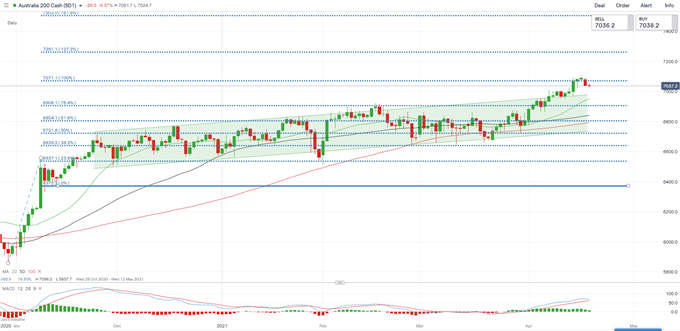
ASX 200 Index Technical Analysis:
The ASX 200 index hit an immediate resistance level at 7,071 (the 100% Fibonacci extension) and has since retreated. A deeper pullback from here may lead to a test of the ceiling of the “Ascending Channel” that it broke previously. The MACD indicator is flattening, suggesting that buying pressure is fading and a technical pullback is likely.
ASX 200 Index – Daily Chart

--- Written by Margaret Yang, Strategist for DailyFX.com
To contact Margaret, use the Comments section below or @margaretyjy on Twitter


