


Australian Dollar, AUD/USD, Chinese GDP, Industrial Production, Retail Sales, Technical Analysis – Market Alert
- Australian Dollar aiming lower after Chinese GDP, industrial output, retail sales
- Still, fundamental tailwinds may open the door for strong weekly AUD/USD finish
- The currency pair confirmed a break above a Descending Triangle, hinting at gains

The Australian Dollar traded cautiously lower after a slew of key Chinese economic data. GDP in the world’s second-largest economy increased 18.3% y/y in the first quarter, slightly missing the 18.5% estimate. Still, this did mark a record. But, it should be noted that these values are being compared to dismal outcomes at the onset of the coronavirus outbreak a year ago, resulting in a low base effect.
Thus, the quarter-over-quarter reading could be a more insightful view of China’s recovery. This one disappointed further, clocking in at 0.6% versus 1.4% anticipated. It is also much slower than the 3.2% outcome in the fourth quarter of last year. Meanwhile, industrial production came in at 14.1% y/y in March versus 18.0% anticipated, also slightly weaker.
Retail sales figures were more uplifting, coming in at 34.2% y/y in March versus 28.0% estimated. This could be a welcoming sign, especially for a country that is gradually shifting towards becoming a more consumption-oriented economy. Nevertheless, the data continues to highlight that the road ahead to recovery remains challenging, but recent estimates from the IMF hint that global growth could come in stronger-than-expected.
China is Australia’s largest trading partner, so economic outcomes in the former can often imply knock-on impacts for the latter. Hence, the Australian Dollar can be quite sensitive to what happens in the world’s second-largest economy. Not to mention, AUD/USD can also be viewed as a more liquid proxy for market sentiment about Chinese economic trends than local assets.
Heading into the remaining 24 hours, the growth-linked Aussie will likely continue to focus on risk trends and Treasury markets. On Thursday, AUD/USD gained amid falling bond yields in the US despite strong retail sales figures. Ongoing dovish rhetoric from the Fed is likely cooling 2022 rate hike bets. With that in mind, the scope for a rosy University of Michigan Sentiment report to push yields higher during the Wall Street session ahead may be low, paving the way for a strong weekly finish for the Aussie.
Check out the DailyFX Economic Calendar for the latest updates on some of these events

Australian Dollar Reaction to Chinese GDP, Industrial Production, Retail Sales
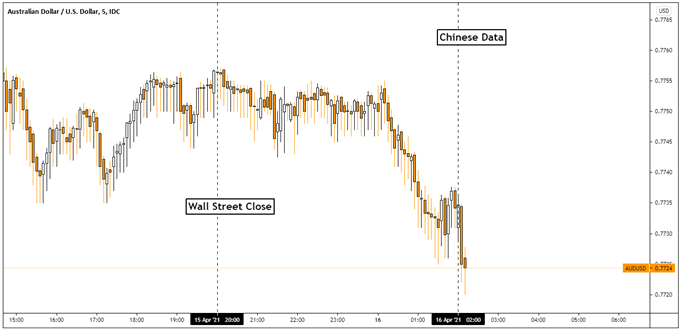
Chart Created Using TradingView
Australian Dollar Technical Analysis
AUD/USD appeared to confirm a break above a Descending Triangle chart pattern, opening the door to reversing the near-term downtrend since late February. This also followed a bounce off the key 0.7532 – 0.7583 support zone and the 100-day Simple Moving Average. Clearing the 0.7798 – 0.7820 inflection zone next may be a signal that the Aussie is ready to perhaps revisit February’s peak.
| Change in | Longs | Shorts | OI |
| Daily | 2% | 3% | 2% |
| Weekly | 29% | -46% | 0% |
AUD/USD Daily Chart

Chart Created Using TradingView
--- Written by Daniel Dubrovsky, Strategist for DailyFX.com
To contact Daniel, use the comments section below or @ddubrovskyFX on Twitter
https://www.tradingview.com/symbols/AUDUSD/?exchange=FX_IDC


