


NASDAQ 100, NIKKEI 225, ASX 200 INDEX OUTLOOK:
- Dow Jones, S&P 500 and Nasdaq 100 closed -0.01%, -0.55 and -1.68% respectively
- Crude oil prices jumped 5% after the Suez Canal was blocked by a giant container ship
- Nikkei 225 and ASX 200 indices traded mildly higher despite tech rout
Crude oil, US Data, Tech selloff, Asia-Pacific at Open:
The Nasdaq 100 index fell 1.68% as investors continued to rotate out from tech into cyclical stocks, pulling the other two major US equity indices into the negative territory. The energy sector was boosted by a 5% rally in crude oil prices after the Suez Canal was blocked by a giant container ship. The incident may affect around 10% of the world’s total seabound oil trade, and thus serve as a temporary positive catalyst for oil prices.
Overnight US data were not particularly encouraging, with durable goods orders in February contracting by 1.1% MoM, compared to a baseline forecast of 0.8% growth. This suggests that business spending on equipment in the month may have cooled due to extreme cold weather conditions. Meanwhile, the Markit Manufacturing PMI reading came in at 59.0, which missed analysts’ forecast of 59.3, but still showed a robust recovery in manufacturing activity. It is worth noting that the new orders measure jumped to the highest since June 2014.
Sentiment remains fragile as the haven-linked US Dollar and Treasuries are still on bid. The DXY US Dollar index climbed to 92.53 - its highest level since November 23rd. The 10-year Treasury yield receded for a fourth day to 1.61% as the 5-year note auction went smoothly on Wednesday. The 7-year note auction will be closely watched on Thursday.
Markit US Manufacturing PMI (March)
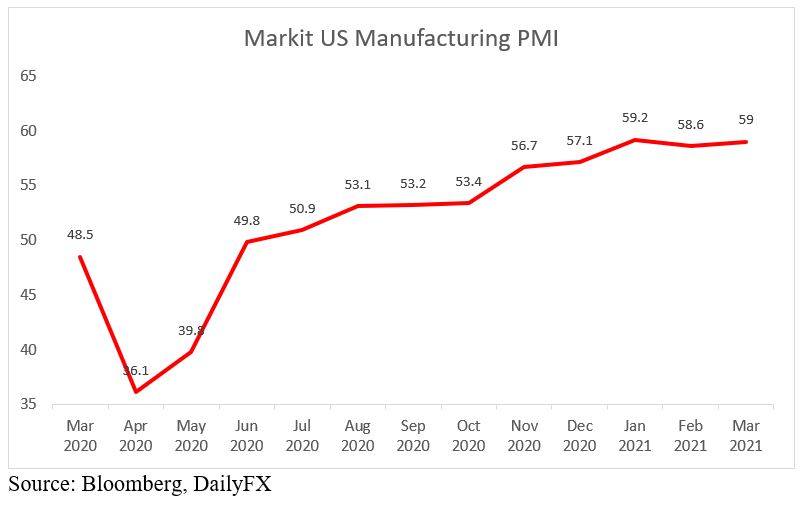
Source: Bloomberg, DailyFX
It appears that the energy sector is doing the heavy-lifting across Asia-Pacific markets, while information technology remains a lag. Australia’s ASX 200 index opened marginally higher, led by energy (+1.90%), health care (+0.34%) and real estate (+0.30%) sectors, whereas information technology (-1.13%), utilities (-0.44%) and consumer staples (-0.22%) trailed behind.
Japan’s Nikkei 225 index traded slightly higher at open after falling over 2% a day before. The index was weighed by BOJ’s decision to shift away from purchasing Nikkei 225 ETFs to buying only those tracking the Topix index. Meanwhile, a partial shutdown of a major semiconductor company added concerns about chip supplies to the auto industry.
Looking ahead, German GfK consumer confidence headlines the economic docket alongside US final Q4 GDP growth and initial jobless claims data. Find out more from the DailyFX calendar.
Looking back to Wednesday’s close, 5 out of 11 S&P 500 sectors ended higher, with 50.9% of the index’s constituents closing in the green. Energy (+2.52%), industrials (+0.73%) and materials (+0.69%) were among the best performers, while communication services (-1.66%) and consumer discretionary (-1.52%) trailed behind.
S&P 500 Sector Performance 24-03-2021
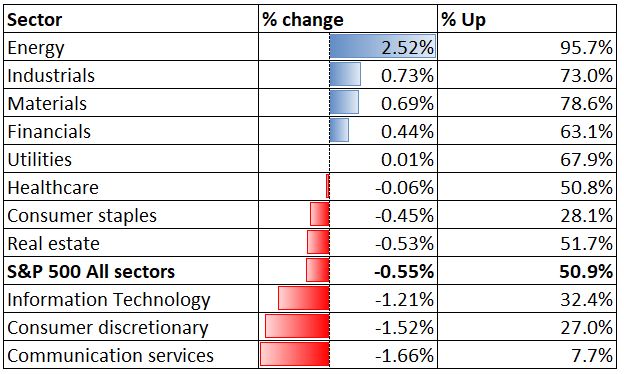
Source: Bloomberg, DailyFX
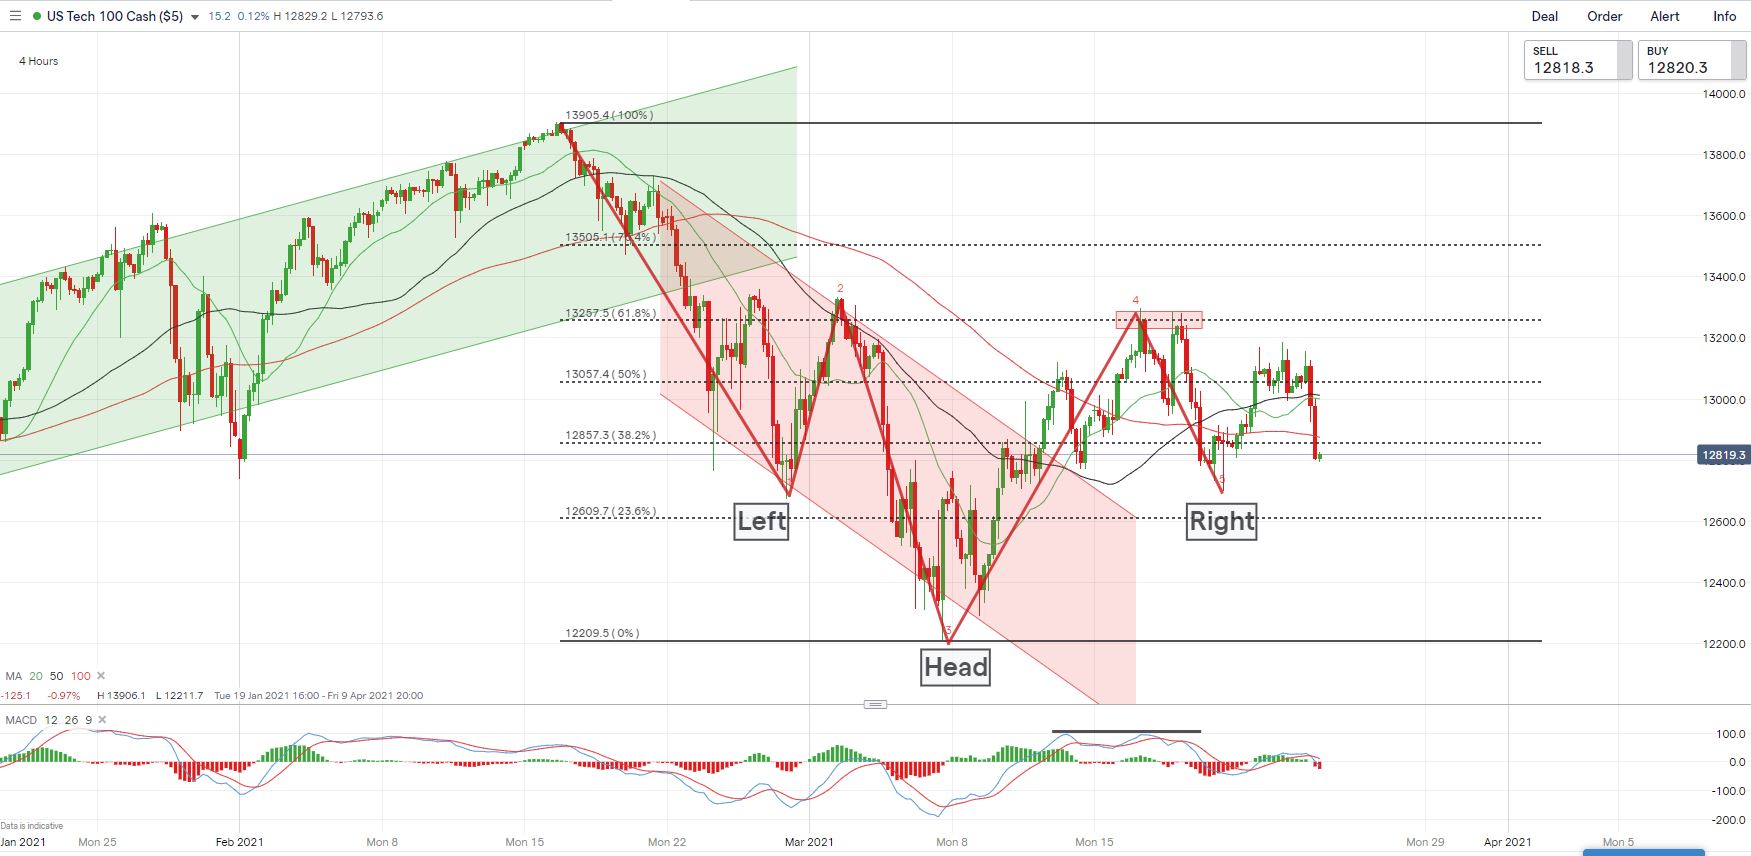
Nasdaq 100 Index Technical Analysis
The inverse “Head and Shoulders” pattern formed on the 4-hour chart suggests that the index could potentially embrace a bullish trend reversal. But a deeper pullback below the right “Shoulder” at 12,690 could invalidate this pattern and open the door for further downside potential. Immediate support and resistance levels can be found at 12,600 (the 23.6% Fibonacci retracement) and 13,050 (the 50% Fibonacci retracement) respectively.
Nasdaq 100 Index – Daily Chart
Nikkei 225 Index Technical Analysis:
The Nikkei 225 index has likely formed a “Double Top” pattern at the 161.8% Fibonacci extension level of 30,455 and has retreated since. The 20-day SMA is about to cross below the 50-day line, potentially forming a bearish crossover. The MACD indicator is trending lower alongside prices, suggesting that downward momentum is prevailing.
Nikkei 225 Index – Daily Chart
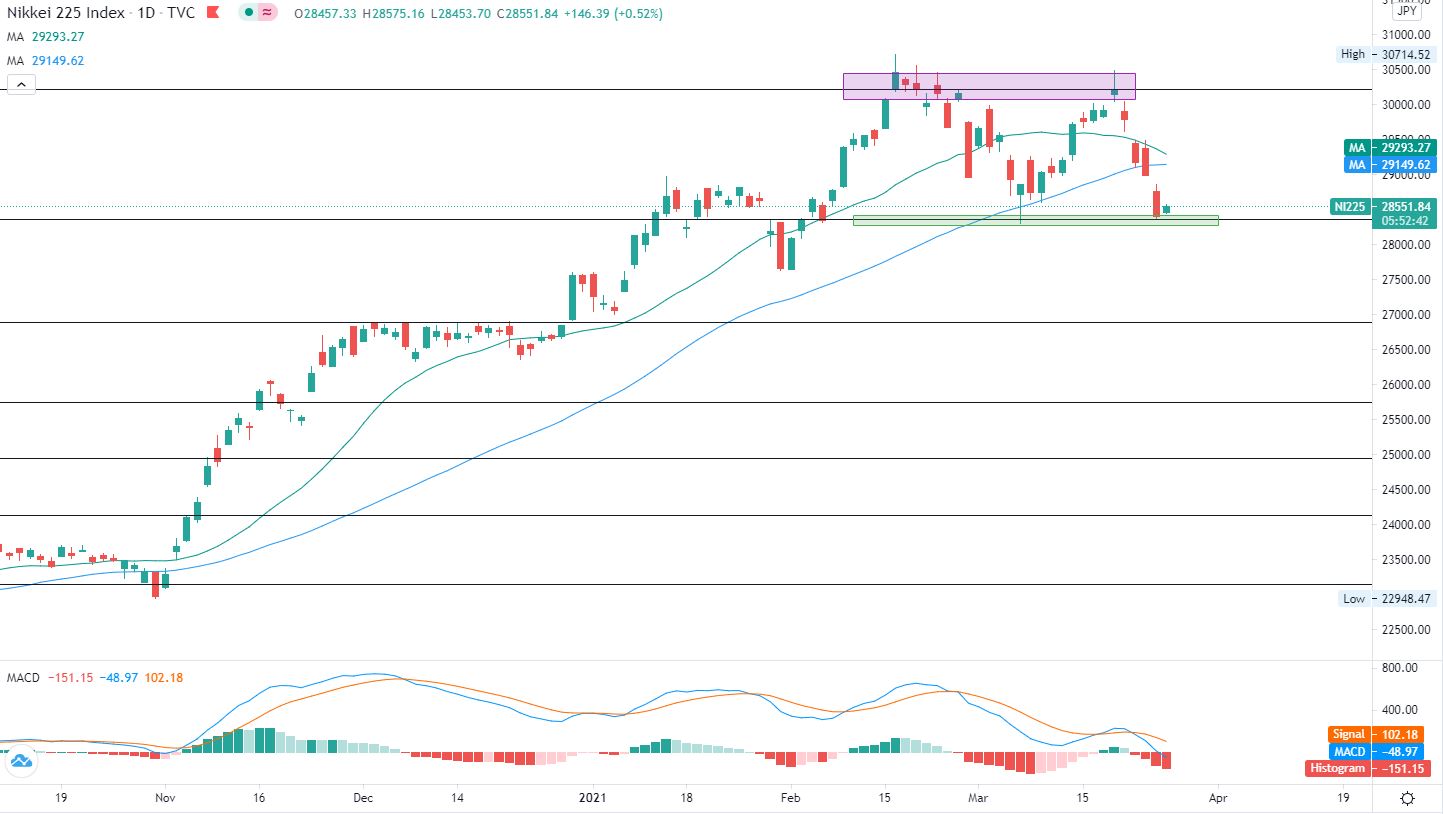
Chart by TradingView
ASX 200 Index Technical Analysis:
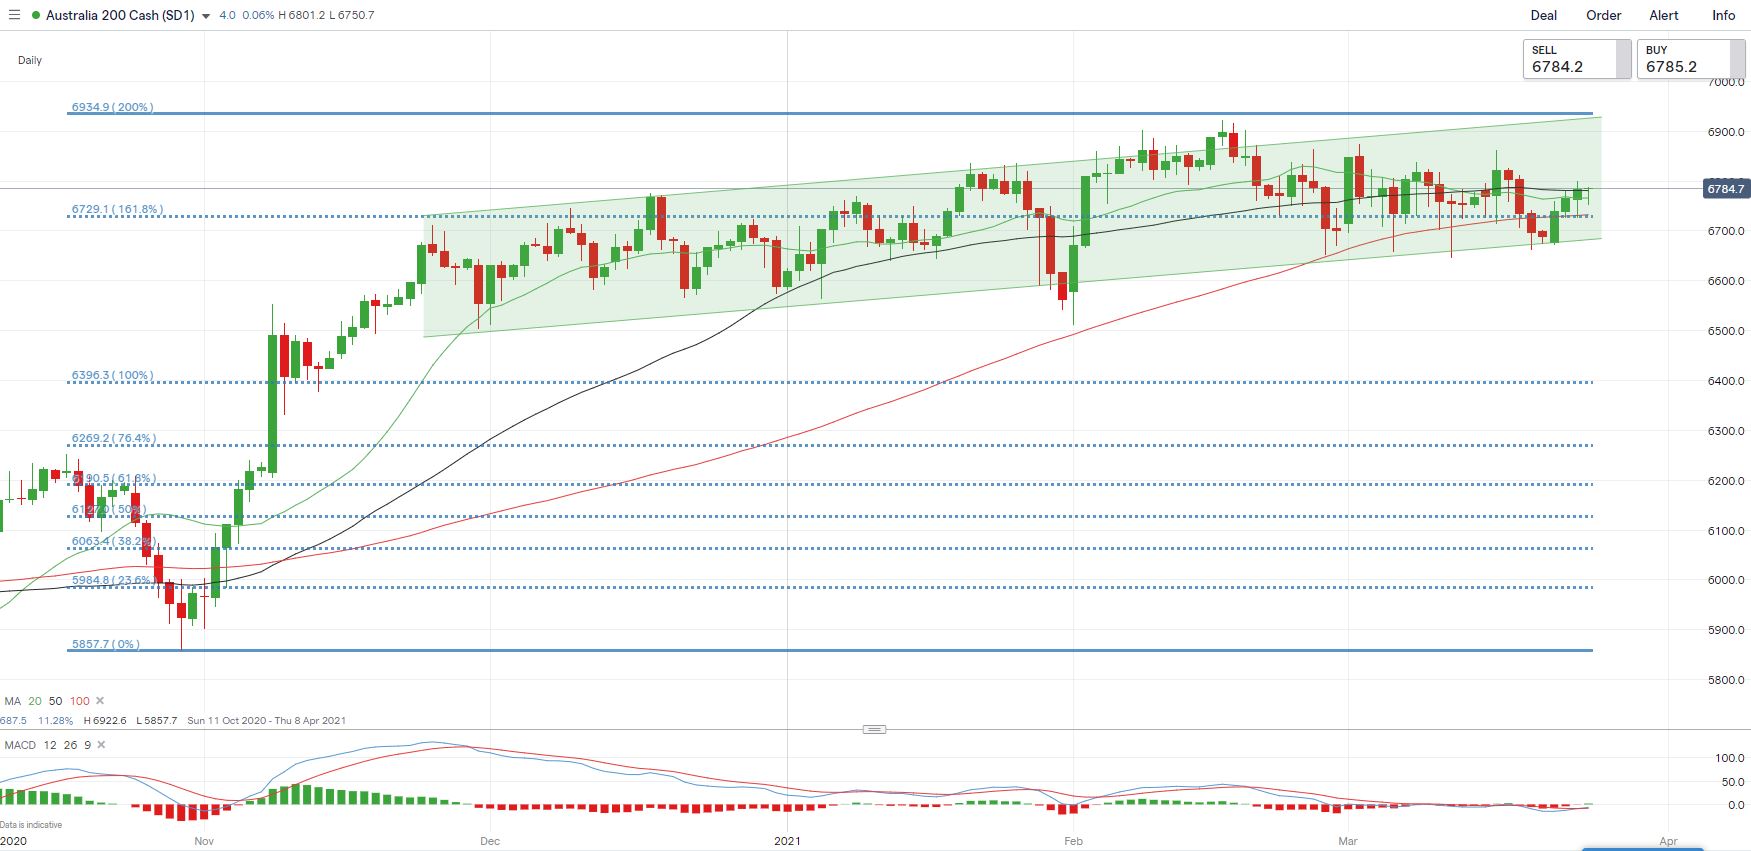
The ASX 200 index bounced off the floor of the “Ascending Channel” and surged above the 50-day SMA line of 6,730 – an immediate resistance. The index appears to have entered a range-bound condition between 6,660 and 6,860 since early March, waiting for fresh catalyst for a clearer direction. The MACD indicator is trending below the neutral midpoint, showing that downward momentum is prevailing.
ASX 200 Index – Daily Chart

--- Written by Margaret Yang, Strategist for DailyFX.com
To contact Margaret, use the Comments section below or @margaretyjy on Twitter


