


USD/ZAR Talking Points:
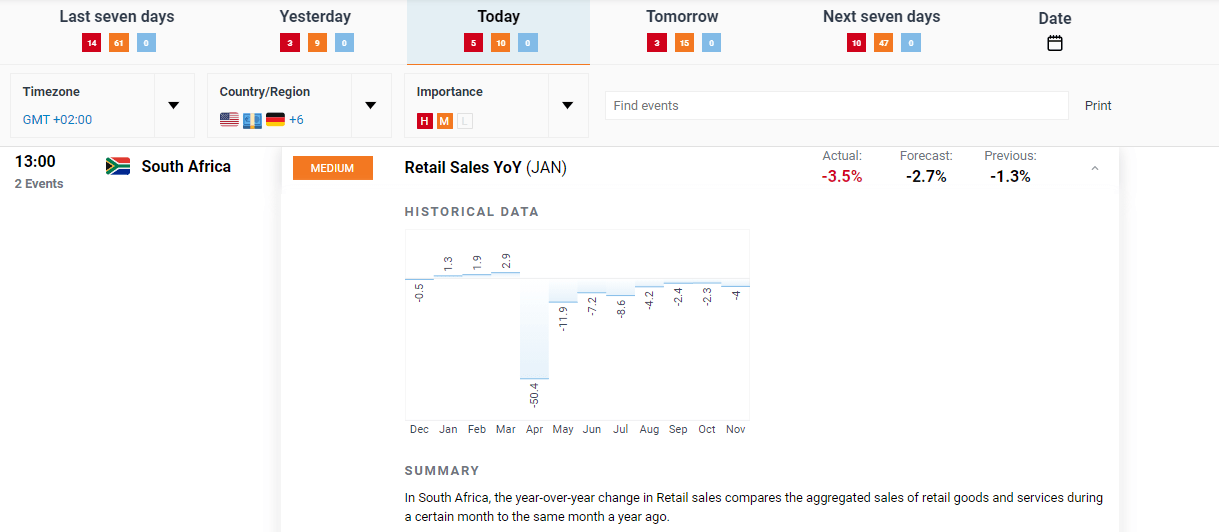
- SA Retail Sales data contracted for a tenth consecutive month (-3.5% YoY)
- USD/ZAR showing little reaction to the data but likely to pick up ahead of FOMC
- USD/ZAR looking for direction but remains within the long term downtrend
SA Retail Sales Continue Ten Month Slump
SA retail sales data came in worse than expected at -3.5% compared to the -2.7% forecasted. This marks the tenth straight decline in year on year data and reflects the continuing challenge the sector faces even after looser Covid-19 restrictions.
For all market-moving data releases and events see the DailyFX Economic Calendar

Immediate Response and Key Technical Levels (USD/ZAR)
The immediate reaction to the release was rather muted as the Rand weakened slightly against the US dollar, approaching the long term trendline. However, the USD/ZAR pair may experience elevated volatility as we count down to the FOMC rate announcement and the eagerly awaited press conference to follow later today.
USD/ZAR 15 Minute Chart

Chart prepared by Richard Snow, IG
The daily chart reveals the long term downtrend that was briefly disrupted earlier this month only to drop back below the long term trendline acting as resistance. The USD/ZAR pair has continued to trade broadly within the 15.7000 to 14.4000 range and currently trades close to the middle of this range (orange dotted line) as market participants await the FOMC speech for direction.
Another break above the long term descending trendline would see the 15.5400 level become the next level of resistance before the top of the range at 15.7000 becomes relevant once more. This remains a possibility as a result of the recent uptick in the greenback via the proxy of the US dollar index (DXY).
However, if the larger theme of US dollar weakness continues and the FOMC communicates further accommodative measures despite an increase in inflation and GDP expectations; this may provide an opportunity for ZAR bulls to extend the USD/ZAR downtrend. Levels of support become 14.7250 before the bottom of the range comes into play at 14.4000
USD/ZAR Daily Chart
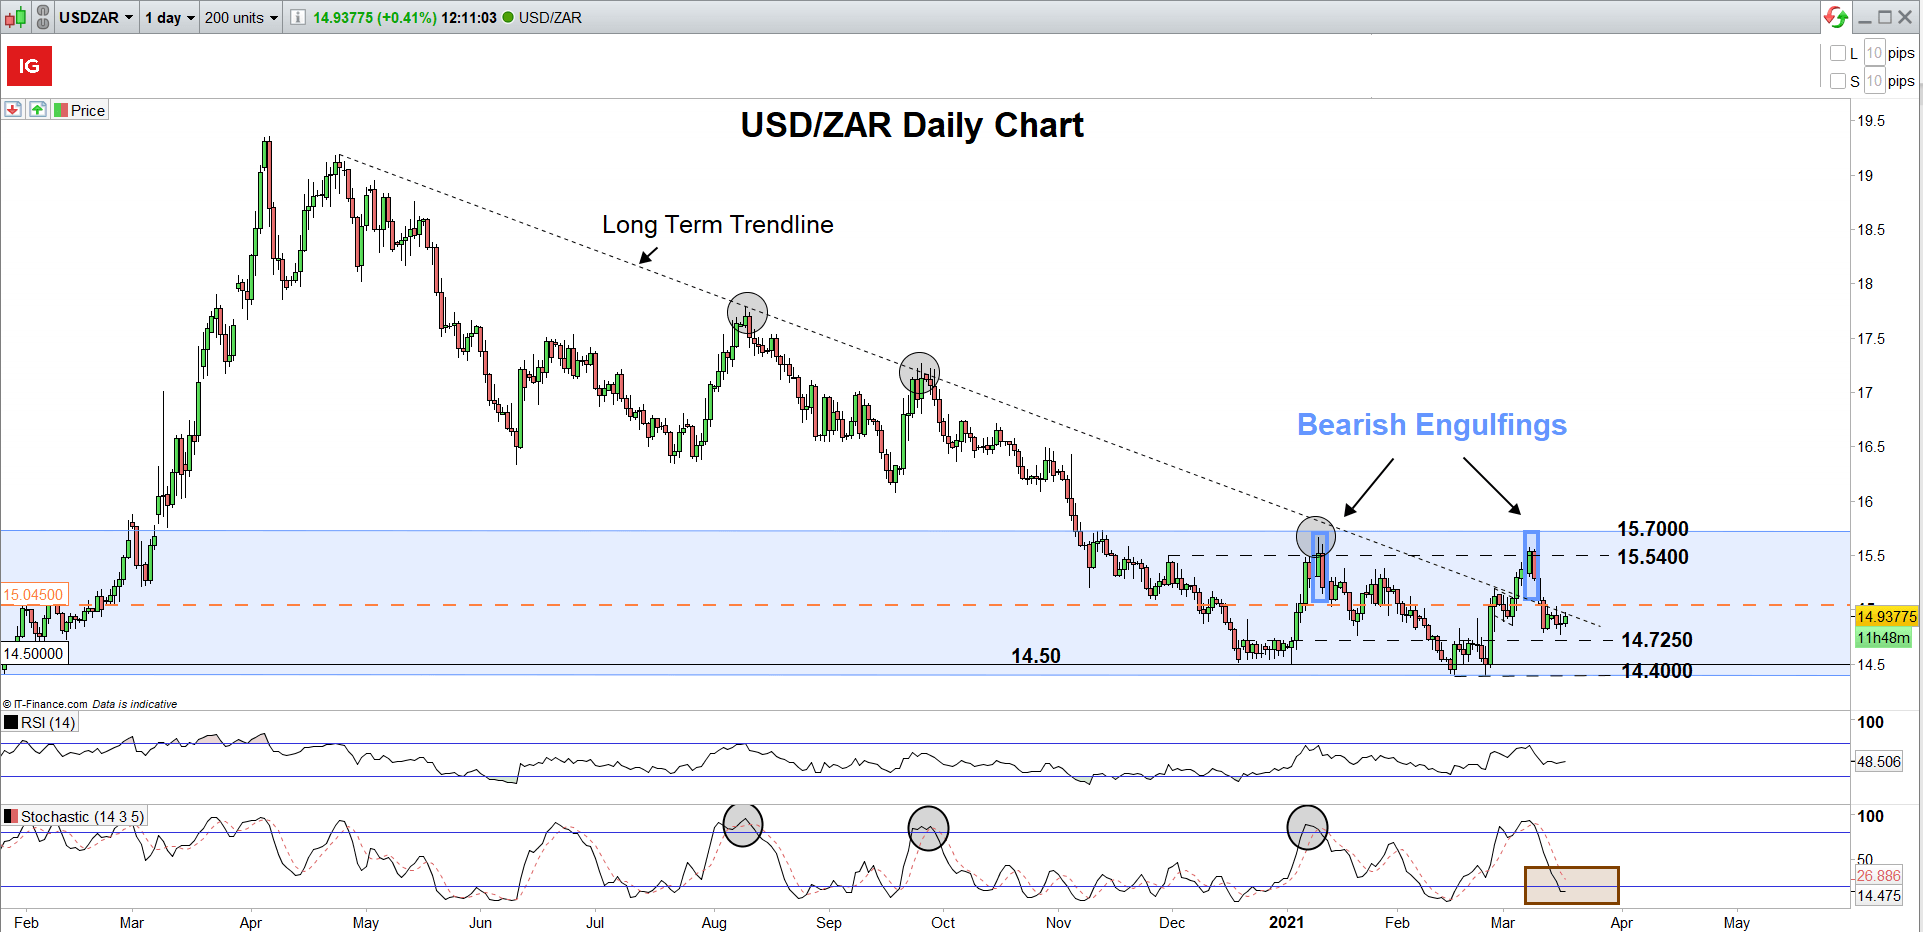
Chart prepared by Richard Snow, IG

--- Written by Richard Snow for DailyFX.com
Contact and follow Richard on Twitter: @RichardSnowFX


