


Dow Jones, Nasdaq 100, S&P 500 Price Outlook:
- US indices ripped higher after the March FOMC meeting delivered a bullish backdrop
- With event risk removed and risk appetite restored, stocks may look to push deeper into record territory
- Dow Jones, Nasdaq 100, DAX 30 Forecasts for the Week Ahead
Dow Jones, Nasdaq 100 and S&P 500 Jump as Fed Opens Door to Risk Rally
The Dow Jones, Nasdaq 100 and S&P 500 surged following the March FOMC policy meeting as Fed officials and Chairman Powell reiterated their policy stance and rate hike expectations. The subsequent press conference allowed Chairman Powell to essentially double down on what was released in the initial report which further opened the floodgates to bullishness in equities. Aside from US equities, other risk assets like Bitcoin and the Australian Dollar surged as US Dollar weakness prevailed.
Dow Jones Price Outlook
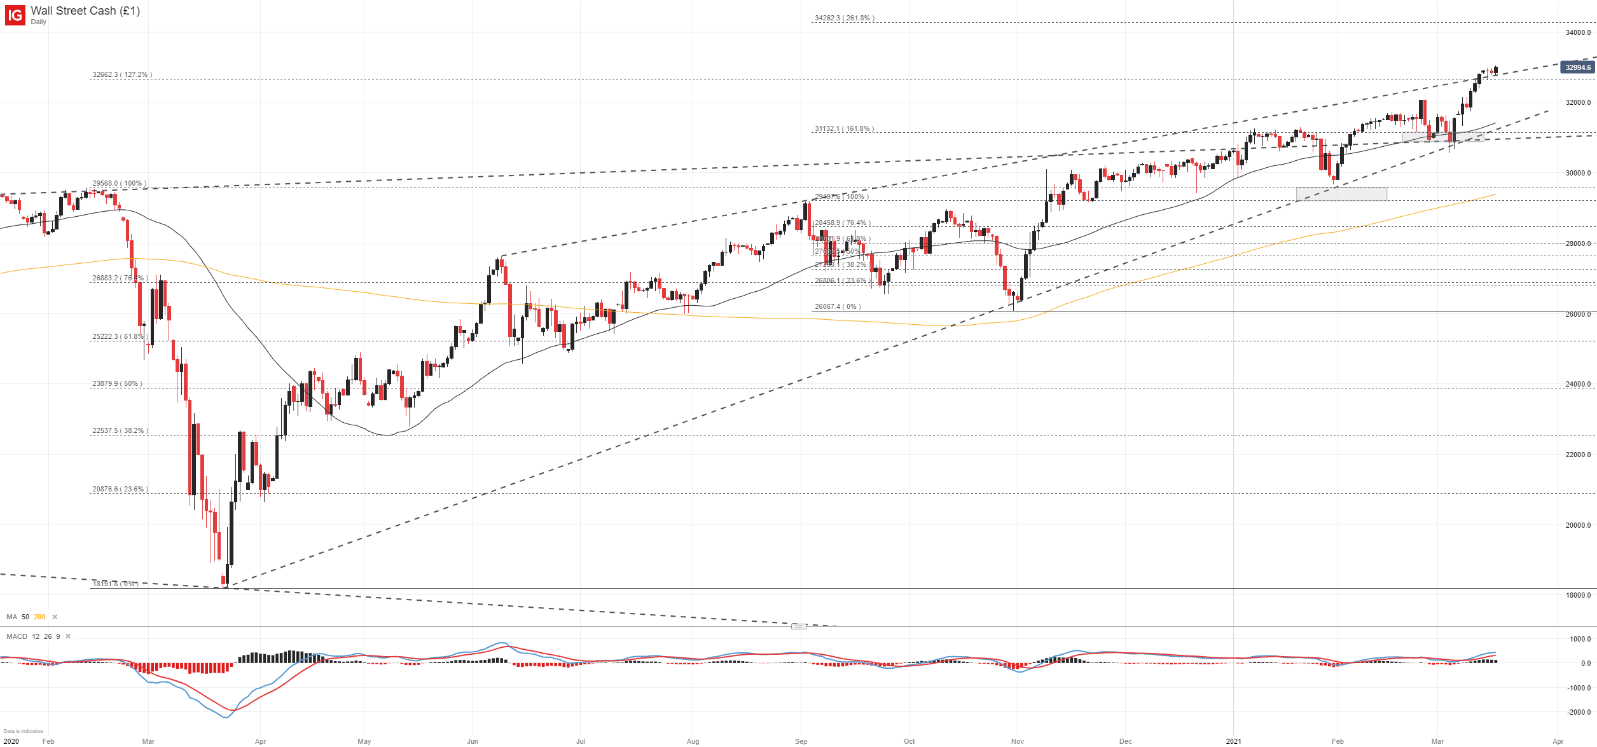
The recent outperformer among US equities, the Dow Jones, may be positioned to charge higher still as the bullish fundamental backdrop has been reaffirmed and the index peers above a key trendline that had helped keep it contained. With uncertainty removed and technical barriers behind it, the Dow Jones enjoys an encouraging price outlook.
Dow Jones Price Chart: Daily Time Frame (January 2020 – March 2021)
Nasdaq 100 Price Outlook
The Nasdaq 100, which has lagged the Dow Jones and S&P 500 over the last few weeks, may also enjoy a continuation higher after a brief break beneath the March trendline. Recent price action saw the MACD line cross above the signal line on the daily chart even as bulls struggled to stave off losses. Crucially, the crossover took place beneath the 0 level while price traded above the 200-day exponential moving average. Thus, the boxes that might suggest gains are ahead have been checked and with event risk removed, the Nasdaq may now enjoy a bullish follow-through.
Nasdaq 100 Price Chart: Daily Time Frame (January 2020 – March 2021)


S&P 500 Price Outlook
The S&P 500 will likely follow the Dow Jones and Nasdaq 100 higher as it looks to break 4,000 for the first time in history. As with any market, trading to new highs can often result in sparse resistance that can see gains gather quickly meaning there might be upside to explore if the psychologically-significant 4,000 mark is broken.
S&P 500 Price Chart: 4 – Hour Time Frame (November 2020 – March 2021)

It would seem the Fed’s projected policy path and improving economic backdrop have opened the door to a continued rally in risk assets that could see the US indices wade deeper into record territory. In the meantime, follow @PeterHanksFX.
--Written by Peter Hanks, Strategist for DailyFX.com
Contact and follow Peter on Twitter @PeterHanksFX


