


USD/JPY Analysis:
- Japan’s state of emergency poses immediate challenge to economic recovery
- USD/JPY approaches significant long-term descending trendline once again
- FOMC rate looks set to remain unchanged; press conference likely to add more insight into asset purchase activity
Japan’s State of Emergency (Tokyo and Surrounding Prefectures)
The Japanese economy performed better than anticipated in Q3 of 2020 with GDP coming in at 5.3% (QoQ), beating an estimate of 5.0%. However the first month of the new year brought about a higher rate of infections in populated regions prompting the Japanese government to implement stricter lockdown measures which are likely to have a negative effect on the economy.
Despite this, Bank of Japan (BoJ) Governor Kuroda communicated that despite the recent headwinds, he expects the local economy to reach pre-pandemic levels by the end of Q1 2022.
USD/JPY Key Technical Levels
USDJPY remains, for now, below the significant long-term descending trendline which has kept the pair contained multiple times (blue circles). Additionally, the 100 simple moving average (SMA) has acted as dynamic resistance over time.
The MACD suggests that the recent bullish momentum may be reaching its conclusion as price approaches the descending trendline. A lower move off this area would highlight 103.30 and 102.60 as the nearest levels of support.
If we are to finally see a sustained break above the descending trendline and the 100 SMA (area roughly presented as the yellow rectangle), then bulls would find the nearest level of resistance at the recent high of 104.40.
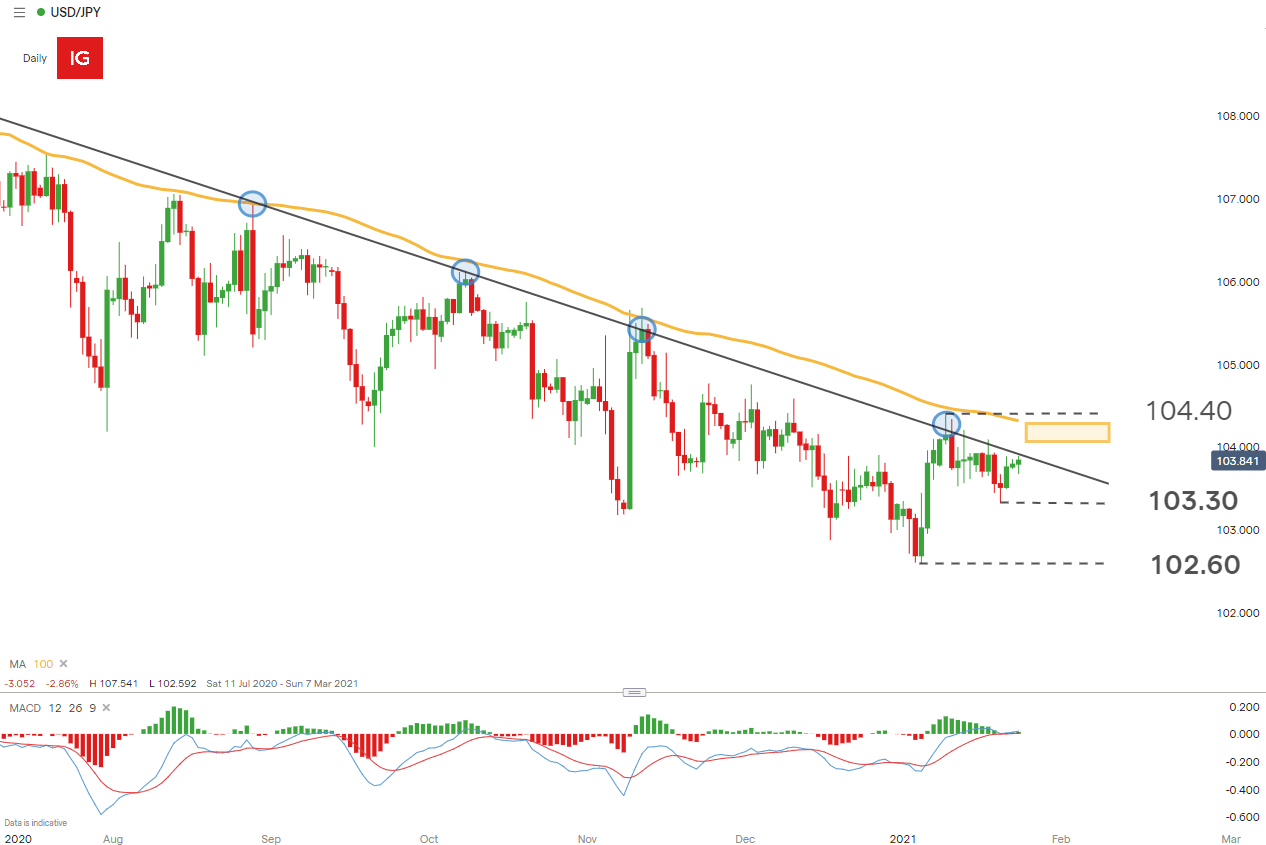
Chart prepared by Richard Snow, IG
| Change in | Longs | Shorts | OI |
| Daily | -2% | 2% | 0% |
| Weekly | 12% | -16% | -6% |
Risk events Ahead: FOMC Rate Announcement on Wednesday
Jerome Powell is anticipated to leave interest rates unchanged (market consensus showing 100% chance of no change – see graphic below ) as the fiscal response to the pandemic takes center stage under the newly elected US President, Joe Biden.
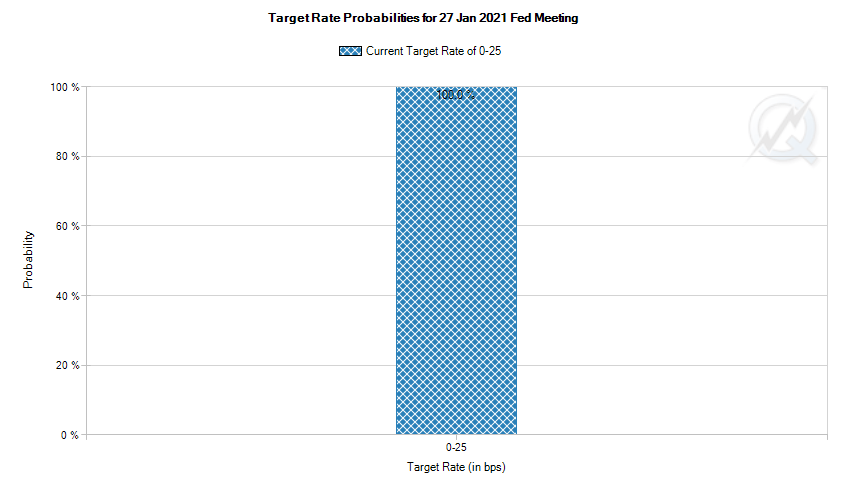
Source: CME Group
The press conference after the meeting tends to overshadow the interest rate announcement as market participants attempt to gauge the path of future monetary policy by observing the comments, tone and sentiment of the Fed Chairman.
For all market-moving data releases and events see the DailyFX Economic Calendar


--- Written by Richard Snow for DailyFX.com
Contact and follow Richard on Twitter: @RichardSnowFX


