


GBP price, UK inflation, news and analysis:
- UK inflation in December was higher than in November and above analysts’ expectations, with the headline rate up 0.6% year/year.
- That is positive for GBP/USD, which continues to rise within the upward-sloping channel on the daily chart that has been in place since late September last year.
GBP/USD advancing, UK inflation higher than predicted
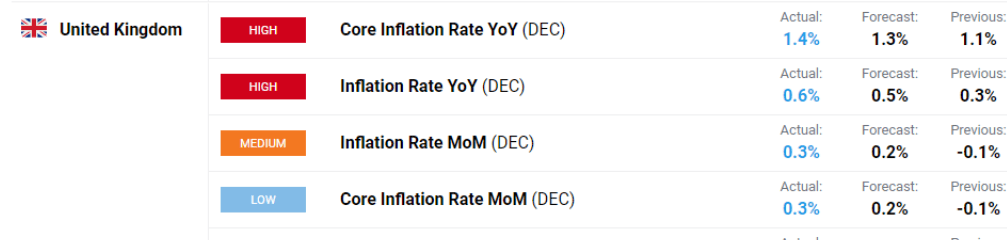
UK inflation in December was higher than in November and above the expectations of analysts polled by the news agencies, with the headline rate climbing to 0.6% year/year compared with the previous 0.3% and the forecast 0.5%.
In normal times an increase in inflation might be expected to spur talk of tighter monetary policy, but with the rate still extremely low and the coronavirus pandemic still the focus of attention that is not going to happen.
UK inflation rises
Source: DailyFX

Nonetheless, the data will do no harm to GBP/USD, which is still rising within the upward-sloping channel on the daily chart in place since late September last year.
GBP/USD Price Chart, Daily Timeframe (September 7, 2020 – January 20, 2021)

Source: IG (You can click on it for a larger image)
As the chart above shows, GBP/USD could reach the 1.38 level in due course. Note, though, that it first needs to break minor resistance around 1.3715, where the price peaked six days ago.
| Change in | Longs | Shorts | OI |
| Daily | -1% | 3% | 1% |
| Weekly | -14% | 21% | -1% |
Risk on in markets
Like many other currencies, GBP has been helped by the current risk-on tone in the markets generated by the prospect of a large injection of money into the US economy and by the rollout of coronavirus vaccines. Those factors continue to outweigh any bad news such as the extension of Covid-19 restrictions in Germany, and will likely continue to do so.
Find out here how to read an economic calendar
We look at currencies regularly in the DailyFX Trading Global Markets Decoded podcasts that you can find here on Apple or wherever you go for your podcasts
--- Written by Martin Essex, Analyst
Feel free to contact me on Twitter @MartinSEssex


