


USD/ZAR Price Outlook:
- USD/ZAR continues downtrend, fueled by stimulus talks
- RSI borders oversold territory
- EMA provides support
USD/ZAR continues to test key levels after falling to a prominent level of support, at the psychological level of 14.500. This comes during a month that could mark eight consecutive months of gains for the South African Rand, buoyed by US Dollar weakness and an increase in the demand for Emerging Market (EM) currencies. With stimulus talks finally nearing the final stages, sentiment regarding the greenback has continued to take strain against its counterparts.
Meanwhile, looking at the monthly chart, price action appears to be confined to the 55-period Exponential Moving Average (EMA) which has provided support for the pair since September 2011. However, the Moving Average Convergence/Divergence (MACD) remains above the zero-line, despite a recent crossover suggesting that further downside is still probable, at least in the short-term.
However, at the peak of summer, when holiday makers and tourists appreciate the South African summer, tighter restrictions and the implementation of travel bans have resulted in whipsaw price action between the ZAR and major currency pairs.
USD/ZAR Monthly Chart
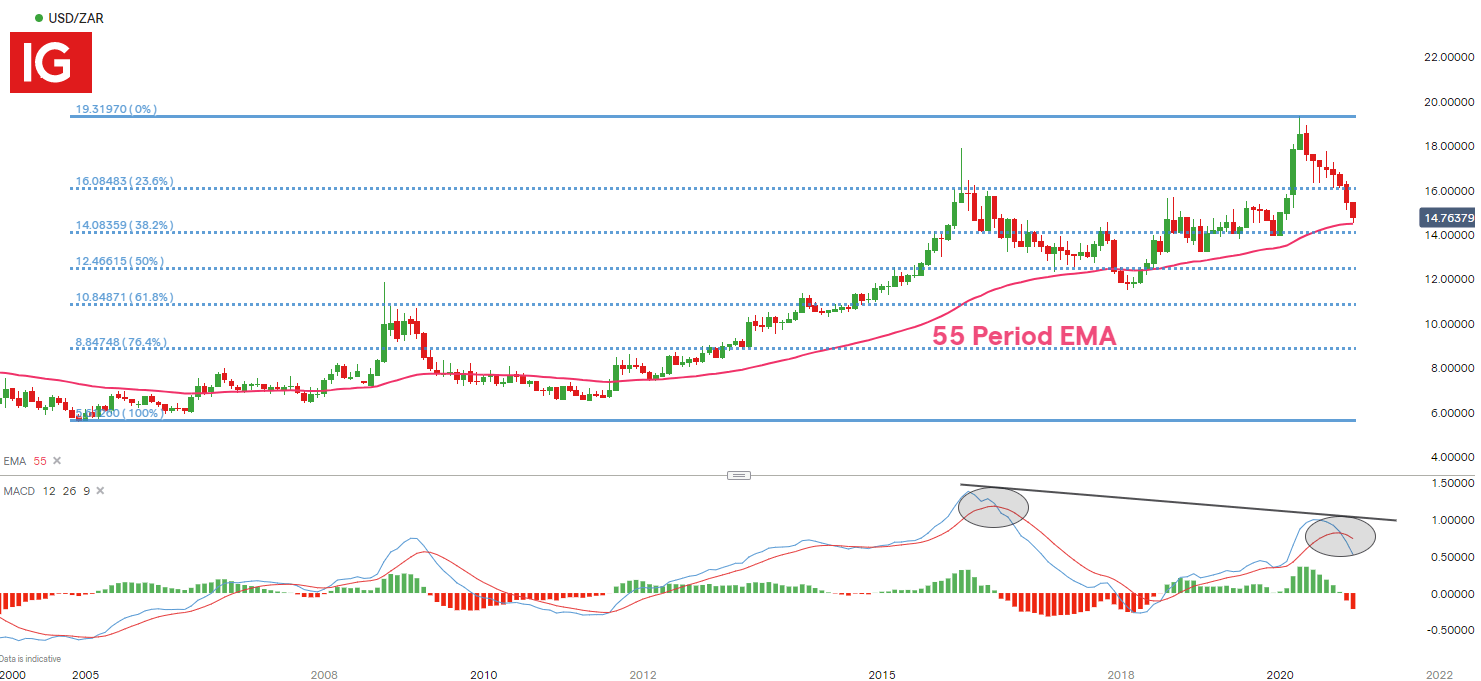
Chart prepared by Tammy Da Costa, IG
Declining Trendline Holds Bulls at Bay
Meanwhile, on the daily chart, the declining trendline has continued to form a barrier of resistance that is preventing the bulls from gaining control. The Relative Strength Index (RSI) is hovering around the 30 line, a potential indication that the pair may be nearing oversold territory.

USD/ZAR Daily Chart
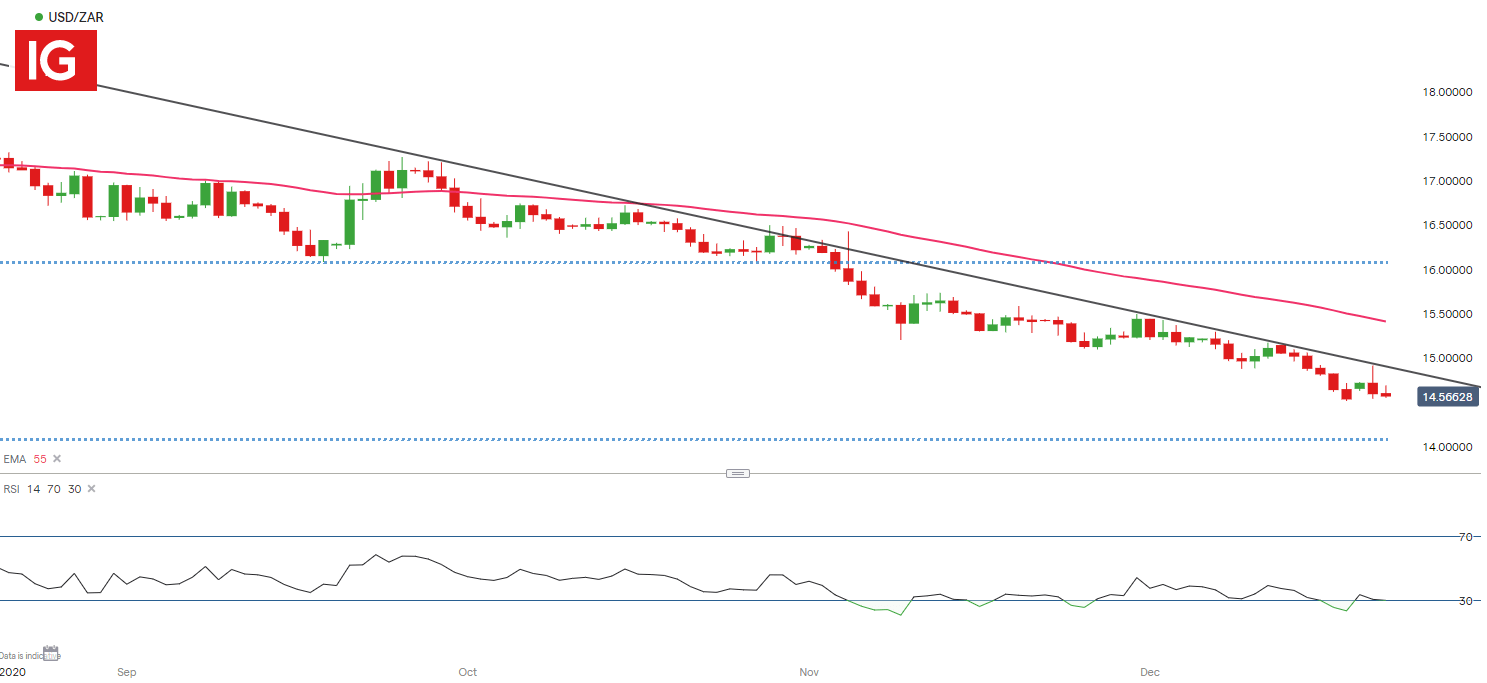
Chart prepared by Tammy Da Costa, IG
USD/ZAR Strategy Ahead
As long as USD/ZAR remains below the declining trendline and the 55-period EMA, further downside may prevail, with a potential level of support forming at 14,07, the 38.2% Fibonacci retracement level of the major move off the earlier-year high.
However, if the trendline is broken, bulls may be eager to drive prices above the psychological level of 15.00
--- Written by Tammy Da Costa, Market Writer for DailyFX.com
Contact and follow Tammy on Twitter: @Tams707


