


DOW JONES, NIKKEI 225, ASX 200 INDEX OUTLOOK:
- Cyclical sectors pulled back while tech gained as New York and London risk further lockdowns
- China industrial production and retail sales figures came in line with expectations, showing continuous recovery
- Traders are eyeing a US bipartisan relief package to be revealed later today
Wall Street Pullback, Chinese Data, Stimulus, Asia-Pacific at Midday:
Tech outperformed cyclical sectors on Monday as investors weighed stricter lockdown measures in major cities including New York and London in the wake of the rapid resurgence of the Covid-19 virus. The Dow Jones and S&P 500 fell 0.62% and 0.44% respectively whereas the tech-led Nasdaq 100 gained 0.5%.
Asia-Pacific markets are trading broadly lower on Tuesday following a bearish-tilted lead from the US. The Nikkei 225, Hang Seng Index, Shanghai Composite and the ASX 200 are drifting lower mid-day, setting a souring tone for the rest of the Asia-Pacific markets. Singapore’s Straits Times Index lost 0.36% even after Prime Minister Lee Hsien Loong announced Phase 3 of economic opening-up on Monday.
Equity markets have probably priced in an initial launch of coronavirus vaccines in their astonishing rally in November. For now, more time might be needed for their gradual rollout to bring down daily cases and show effectiveness in containing the pandemic. Therefore, the technology sector once again became market’s safety shelter, as consumers turn to e-commerce and other digital services for the Christmas shopping season in the face of wider lockdowns.
On a separate note, Chinese industrial production and retail sales figures came in at 7.0% and 5.0% YoY respectively, in line with expectations. Both outcomes pointed to a healthy recovery form the pandemic for the world’s second-largest economy. This came alongside strong export and manufacturing PMI readings in recent months, underpinning the strength of the Chinese Yuan. Consumer spending appears to have capitalized on the tailwind of Beijing’s “Internal Circulation” strategy, alongside Alibaba’s “Singles Day” shopping event in early November.
China Industrial Production YoY - Forecast

Source: Bloomberg, DailyFX
China Retail Sales YoY - Forecast

Source: Bloomberg, DailyFX
Sector-wise, 7 out of 9 Dow Jones sectors ended lower, with 80% of the index’s constituents closing in the red on Monday. Energy (-3.26%), communication services (-2.88%) and materials (-1.74%) were among the laggards, while consumer discretionary (+0.67%) and information technology (+0.01%) outperformed.
Dow Jones Sector Performance 14-12-2020

Source: Bloomberg, DailyFX

Dow Jones Technical Analysis
The Dow Jones index appears to have entered a period of consolidation with an eye on 29,950 for support. The overall trend remains bullish-biased, as suggested by upward-sloped 20-, 50- and 100-Day Simple Moving Average (SMA) lines. Its upward momentum, however, appears to be faltering as the MACD indicator trends lower after the formation of a “Death Cross” in early December.
Dow Jones Index – Daily Chart

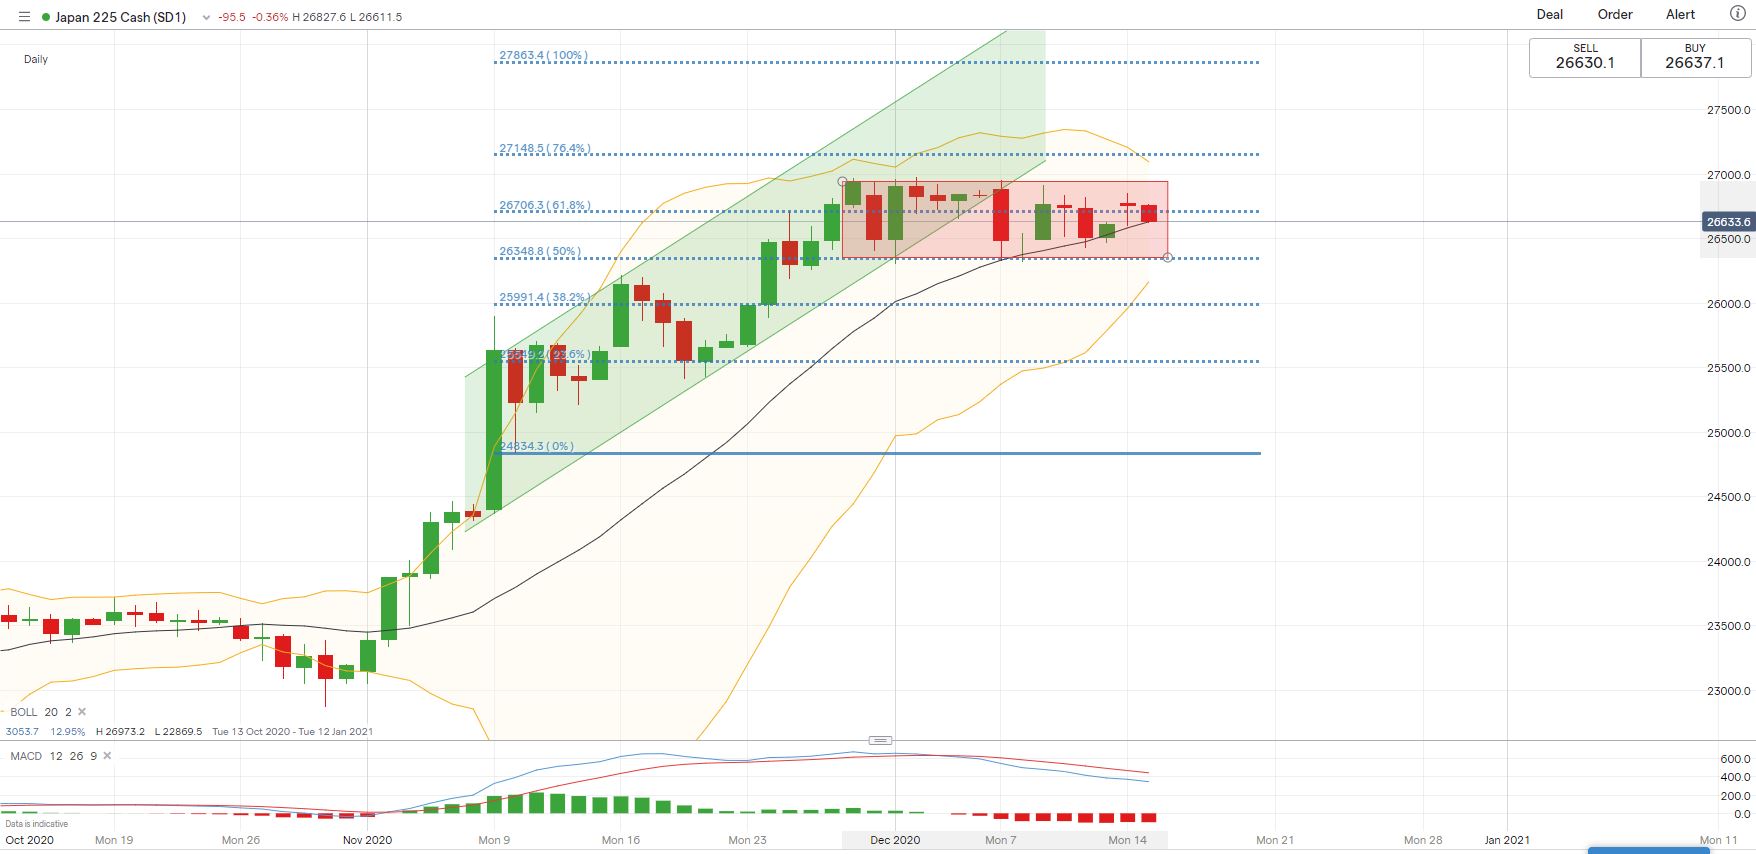
Nikkei 225 Index Technical Analysis:
The Nikkei 225 index has been trading in a “range-bound” condition since early December as highlighted in red color below. An immediate support level can be found at 26,350 - the 50% Fibonacci extension. Breaking this support may open the door for further losses with an eye on 25,990 for support.
Nikkei 225 Index – Daily Chart
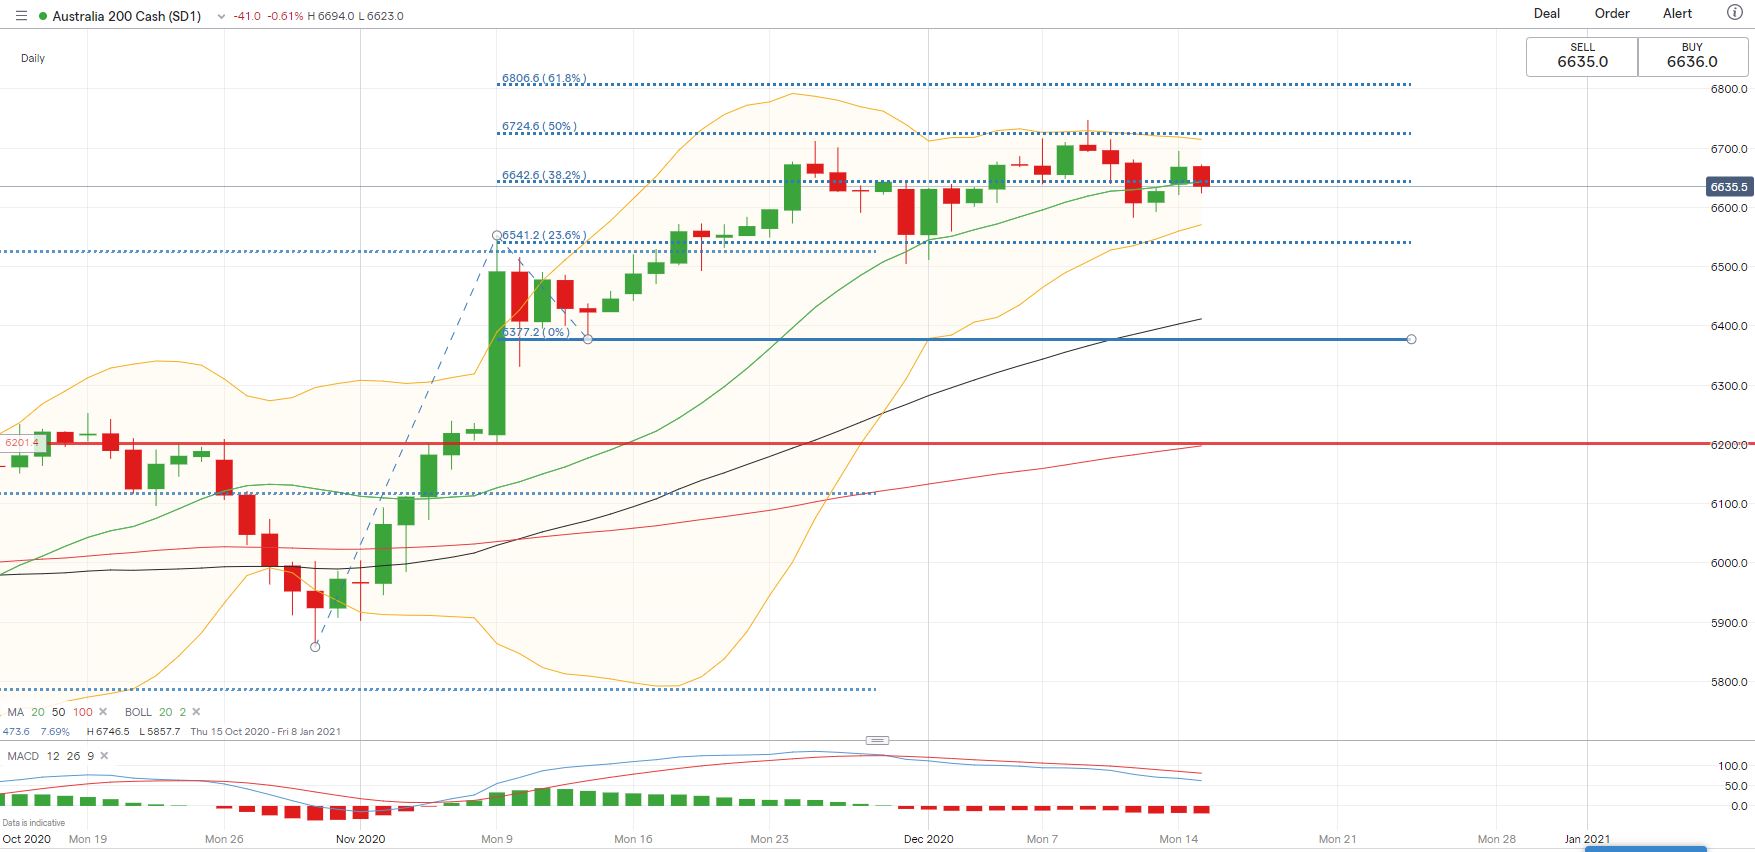
ASX 200 Index Technical Analysis:
The ascending trend of the ASX 200 index remains intact in the near term, but the upward momentum appears to be fading. An immediate support level can be found at 6,640 – the 38.2% Fibonacci extension. Narrowing Bollinger Band width reflects weakening momentum, and a deeper pullback is possible if price breaks the 20-Day SMA line.
ASX 200 Index – Daily Chart

--- Written by Margaret Yang, Strategist for DailyFX.com
To contact Margaret, use the Comments section below or @margaretyjy on Twitter


