


S&P 500, ASX 200 Index, ASIA-PACIFIC MARKET OUTLOOK:
- The S&P 500 Index fell a second day as US stimulus bill stalled, Facebook under antitrust lawsuit
- Australia’s ASX 200 index has likely entered a consolidative period, eyeing 6,630 for support
- Asia-Pacific markets may trade in mixed tone; Crude oil prices surged to an 8-month high
Asia-Pacific stocks are poised to end the week with a mixed tone after the S&P 500 index registered two-day losses. The Nasdaq index rebounded by half a percent after deep losses seen a day earlier. Stalling US stimulus talks alongside the Facebook antitrust case weighed on sentiment, while FDA advisors voted in favor of Pfizer’s Covid vaccine in a critical meeting on Thursday.
Iron ore prices continued their upward trajectory as strong demand from Asia as well as vaccine optimism propelled prospects for metals. Copper prices also reached multi-year highs. The ascending metal trend may offer some cushion for the commodity-reliant ASX 200 index against external headwinds. BHP Group and Fortescue Metals Group may defy gravity and trade higher on Friday.
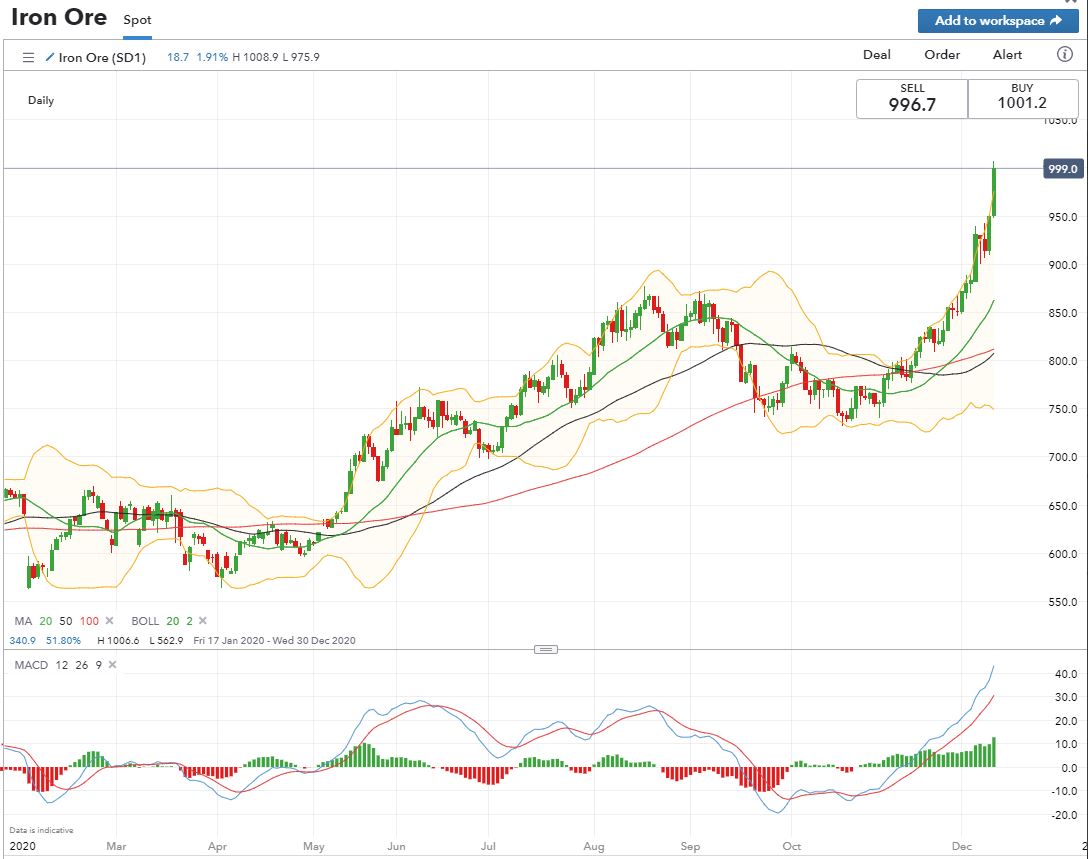
Chart from IG
Crude oil prices had a big jump and broke a key chart resistance on Thursday. As a result, energy (+2.92%) became the best performing sector among the S&P 500 overnight. WTI has surged to an 8-month high of US$ 47.16 this morning, boosted by vaccine hopes, a weaker US Dollar as well as a gradual production hike commitment agreed among OPEC+ members earlier this month.
On the macro front, US weekly jobless claims disappointed investors with a higher-than-expected reading of 853k. The figure not only surpassed the baseline forecast of 725k by a significant amount, but also marked an 8-week high. Rising unemployment filings in recent weeks alongside a tepid nonfarm payrolls report released last Friday pointed to deteriorating job market sentiment as the pandemic wave hit. This may lead the US Dollar lower. Read more on DailyFX’s economic calendar.
Weekly US Jobless Claims
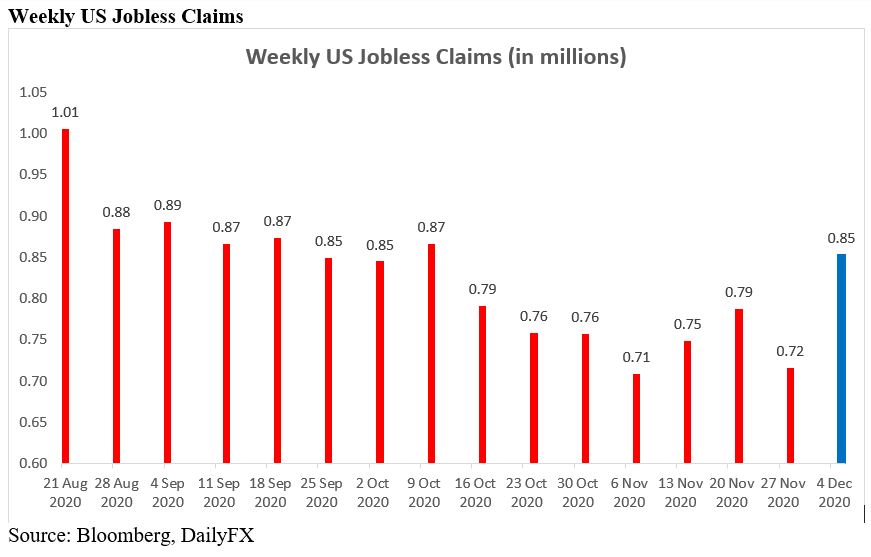
Source: Bloomberg, DailyFX

Sector-wise, 8 out of 11 S&P 500 sectors closed in the red, with 61% of the index’s constituents ending lower on Thursday. Energy (+2.92%), financials (+0.16%) and information technology (+0.07%) were doing the heavy lifting, whereas industrials (-0.93%), materials (-0.71%) and utilities (-0.51%) were among the worst performers.
S&P 500 Sector Performance 10-12-2020
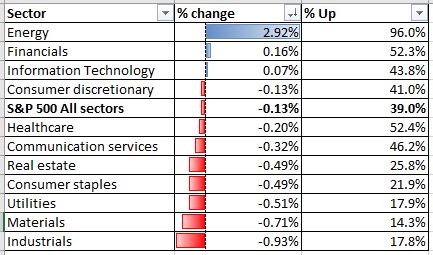
Source: Bloomberg, DailyFX

S&P 500 Index Technical Analysis:
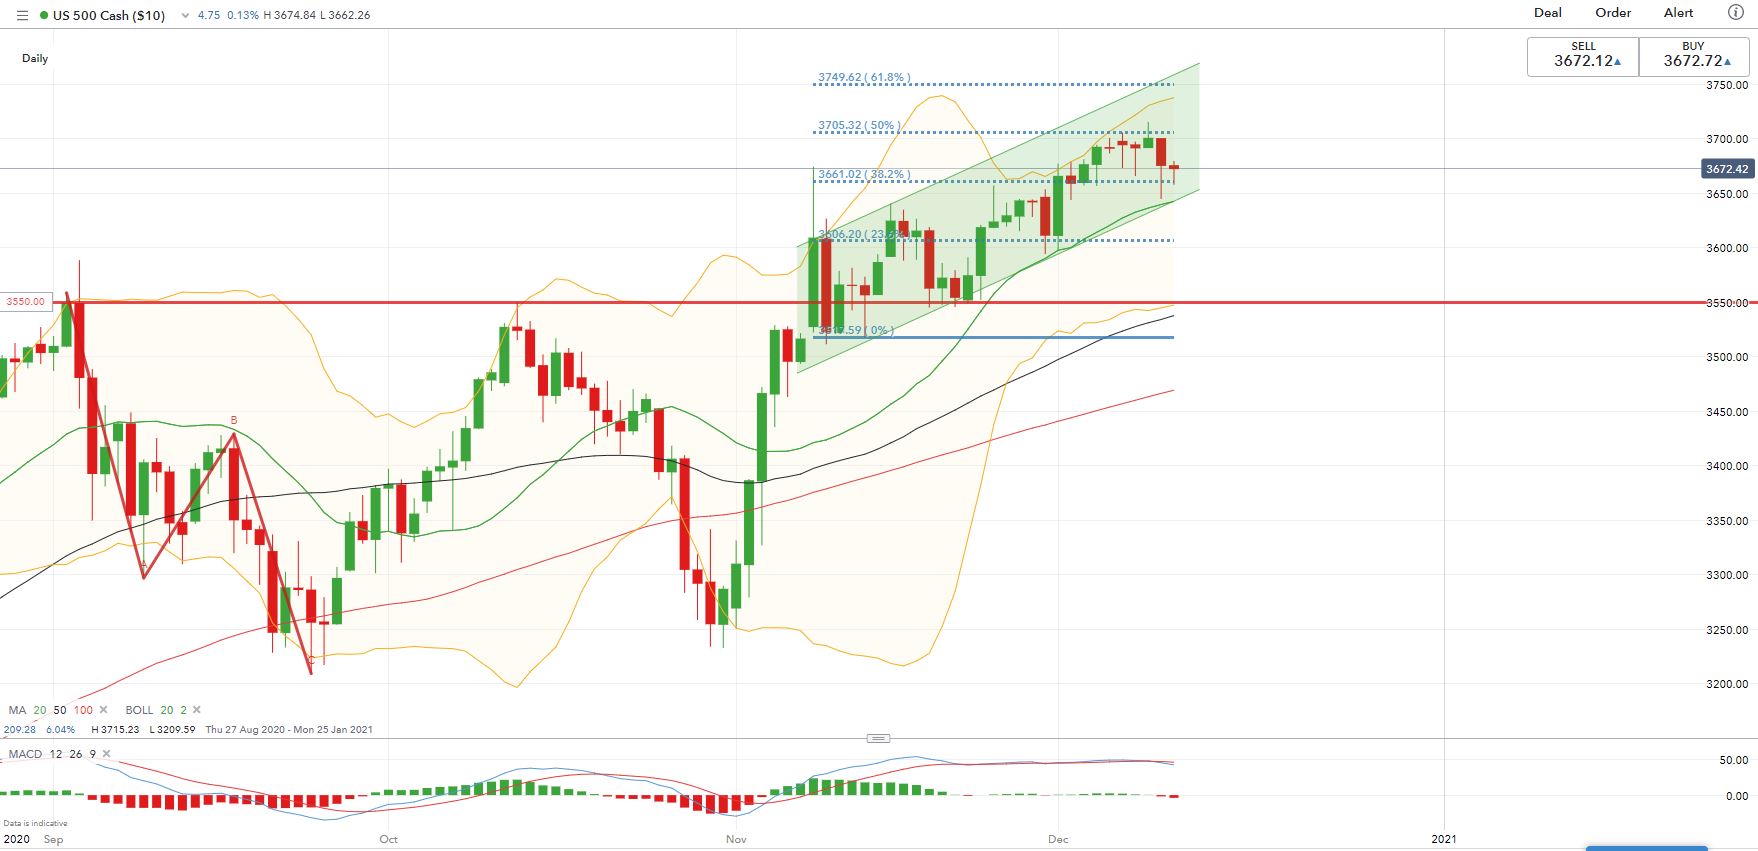
The S&P 500 index appears to be ranging higher within an “Ascending Channel” as highlighted in the chart below. The uptrend was well supported by its 20-Day Simple Moving Average (SMA) line, although some short-term pullbacks were observed. Immediate support and resistance levels can be found at 3,660 (38.2% Fibonacci extension) and 3,705 (50% Fibonacci extension) respectively. The index may have entered another healthy correction amid an overall upward trajectory.
S&P 500 Index – Daily Chart
ASX 200 Index Technical Analysis:
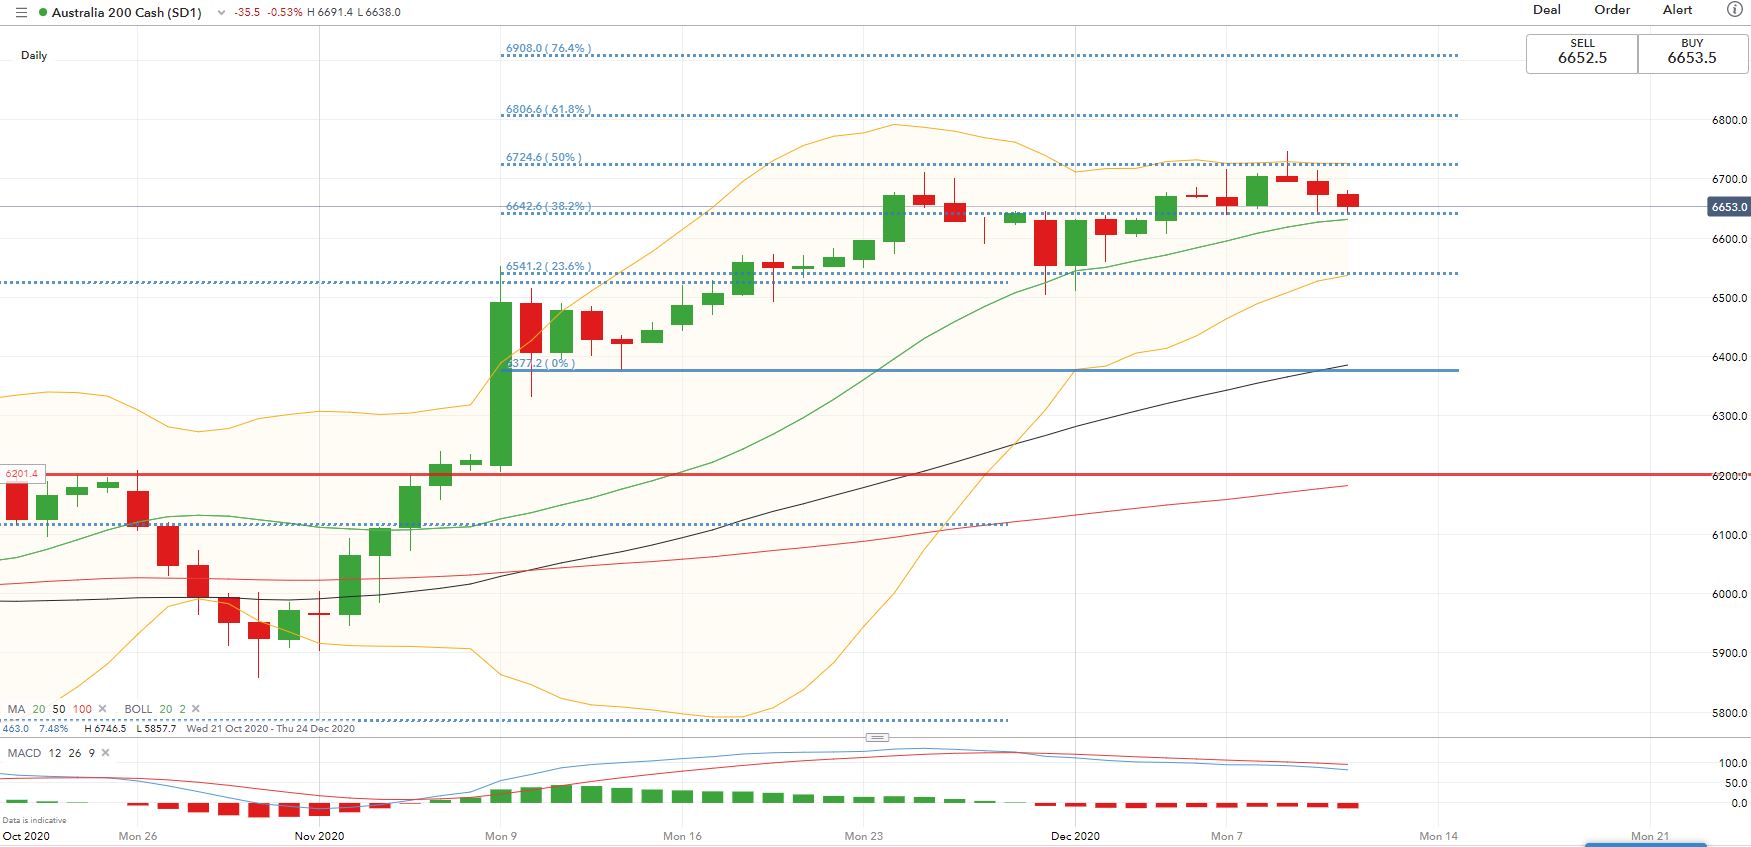
The ASX 200 index entered a brief correction after hitting a 9-month high. The overall bullish trend remains intact though, as suggested by the ascending 20-Day Simple Moving Average (SMA) line. The index is testing a key support level of 6,630 – where its 38.2% Fibonacci extension and 20-Day SMA intercept. Holding above this level may pave the way for further upside potential towards 6,724 – the 50% Fibonacci extension.
ASX 200 Index – Daily Chart

--- Written by Margaret Yang, Strategist for DailyFX.com
To contact Margaret, use the Comments section below or @margaretyjy on Twitter


