Gold (XAU/USD) Analysis, Price and Chart
- Gold bounces off Fibonacci support.
- Fibonacci and moving average resistance lies ahead.
Gold continues its short-term bounce back after the heavy falls over the last couple of weeks, boosted by a weaker US dollar. The greenback touched lows last seen in late April 2018 in early trade before turning marginally higher. Tuesday’s weaker-than-expected US ISM print – 57.5 compared to forecasts of 58.0 and a prior reading of 59.3 in October – had knocked the greenback lower, especially after the ISM report showed the employment reading falling to 48.4 compared to forecasts of 51.0 and a prior reading of 53.2. Expectations continue to build that the Fed will deliver further stimulus at the December 15/16 meeting.
How to Trade Gold: Top Gold Trading Strategies and Tips
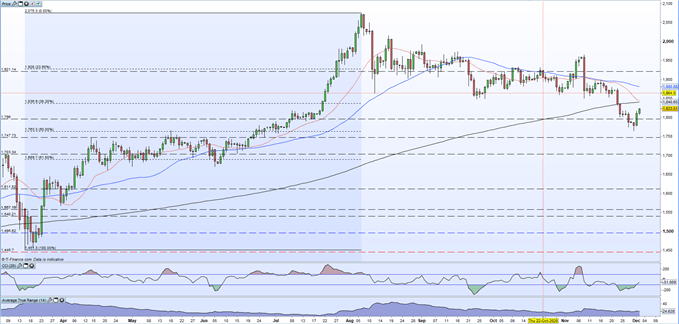
The daily gold chart shows how the 50% Fibonacci retracement level at $1,763.5/oz. stemmed the recent sell-off and provided a springboard for this week’s bounce back. It remains to be seen if this level will hold a second attempt, especially as the market has moved out of oversold territory. Ahead, a cluster of resistance levels comprising $1,836.9/oz (38.2% Fib), the 200-day simple moving average at $1,841/oz. and the 20-day sma at $1,844.5/oz. These three may prove difficult foes for gold bulls.
To learn more about moving averages, check out DailyFX Education
Gold Daily Price Chart (March – December 2, 2020)
| Change in | Longs | Shorts | OI |
| Daily | 1% | 2% | 2% |
| Weekly | 7% | -11% | -2% |
IG retail trader datashow 81.46% of traders are net-long with the ratio of traders long to short at 4.39 to 1.We typically take a contrarian view to crowd sentiment, and the fact traders are net-long suggests Gold prices may continue to fall.Yet traders are less net-long than yesterday and compared with last week. Recent changes in sentiment warn that the current Gold price trend may soon reverse higher despite the fact traders remain net-long.

What is your view on Gold – are you bullish or bearish?? You can let us know via the form at the end of this piece or you can contact the author via Twitter @nickcawley1.