


Nikkei 225 & ASX 200 Price Outlook:
- The Nikkei 225 fell beneath 23,000 as it moves to the midpoint of its rising channel
- The ASX 200 suffered a break beneath 5,800, falling to subsequent support just north of 5,700
- Nasdaq 100, DAX 30 & FTSE 100 Forecasts for the Week Ahead
Nikkei 225 & ASX 200 Price Forecast: Stock Selloff Sees Support Broken
Risk assets awoke to a sea of red this week as equity markets, growth-sensitive currencies and even some safe haven commodities fell under considerable pressure. While many vulnerable markets recovered from their lows as the session progressed, the initial shift in risk appetite worked to undermine important technical structures. This erosion, however brief it may have been, could make it more difficult for bulls to regain their footing as the week unfolds.
Nikkei 225 Price Chart: 4 – Hour Time Frame (May 2020 - September 2020)
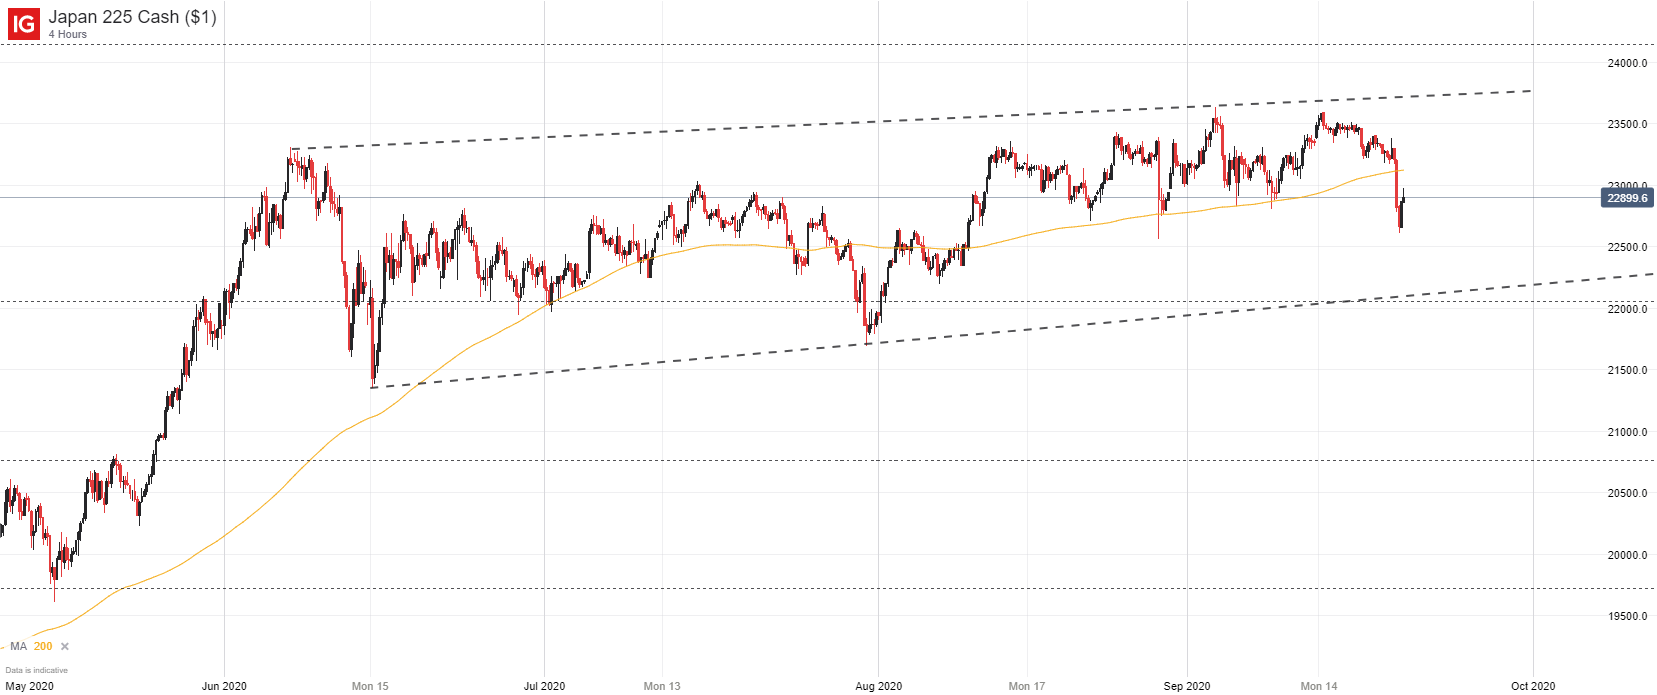
In the case of the Nikkei 225, Monday’s reversal saw the Japanese equity index fall beneath the 200-period moving average and below recent swing lows in August and September. Correspondingly, the Nikkei has fallen near the midpoint of its rising channel dating back to early June which leaves the risk-reward profile somewhat unattractive at this stage.
Stock Market Basics: A Beginner’s Guide to Trading Stocks
Either way, the breakdown is a significant technical development because it effectively terminates the series of higher-lows that the index had enjoyed since August. With a fresh low established, bears may look to continue the drive lower and could probe the lower bound of the channel, slightly above 22,000.
ASX 200 Forecast
Shifting focus to the ASX 200, a similar development can be observed. Exhibiting more weakness than the Nikkei 225 in recent weeks, the ASX 200 had posted a series of lower-highs since September began and with Monday’s move, delivered a fresh lower-low.
How does the Stock Market Affect the Economy? A Trader’s Guide
Evidently, the Australian index has etched out a concerning pattern, one that could lead to further losses if nearby support around 5,700 and 5,643 are broken. These levels appear well within reach of the current trading price and could succumb to selling pressures if risk aversion continues.
ASX 200 Price Chart: 4 – Hour Time Frame (May 2020 - September 2020)

That being said, it is difficult to ascertain a single catalyst behind recent stock losses, so expect volatility to persist in the coming days as traders negotiate the choppy market conditions. To be sure, US-China tensions and US election uncertainty could be feeding into global risk aversion, so the Nasdaq 100 may remain a key bellwether for broader equity performance. In the meantime, follow @PeterHanksFX on Twitter for updates and analysis.
--Written by Peter Hanks, Strategist for DailyFX.com
Contact and follow Peter on Twitter @PeterHanksFX


