


NASDAQ 100, ASX 200, STRAITS TIMES INDEX OUTLOOK:
- Nasdaq 100 index gained 1.8%, boosted by vaccine hopes and Oracle’s potential deal with TikTok
- Australia’s ASX 200 opens flat, oscillating around 5,900 while momentum turning bullish
- Singapore’s Straits Times Index isn’t inspired by US tailwinds, finding support at 2,500
Nasdaq 100 Index Outlook:
The Nasdaq 100 index futures have retraced slightly at early Asia hours, after rising more than 1.8% on Monday. Sentiment has shown signs of improvement on Wall Street as Pfizer’s CEO signaled that a Covid-19 vaccine is “likely” to be deployed to the US public by the end of this year. Besides, US tech giant Oracle is in a potential deal to acquire TikTok’s US operations after Microsoft’s withdrawal. Oracle’s share price advanced 4% before a trading halt took place.
While Wednesday’s FOMC meeting and Thursday’s BOJ andBoE interest rate decisions are among the top events this week, there are some key data to be watched out for today. China’s August industrial production and retail sales are in particular focus.
Chinese industrial production is expected to continue its expansionary trajectory in August, with economists forecasting a 5.1% annualized pace of growth from a year ago. Retail sales growth remained in a soft patch, but is gradually recovering from negative territory in the recent months.
China Industrial Production YoY (%) – Forecast

Source: DailyFX
China Retail Sales YoY (%) – Forecast

Source: Bloomberg, DailyFX
Sector-wise, all eleven S&P 500 sectors ended higher on Monday. The rally was led by real estate (+2.16%), information technology (+2.07%) and materials (+1.37%). Encouragingly, 88.7% of the components in the index closed higher.
S&P 500 Index Sector performance 14-9-2020
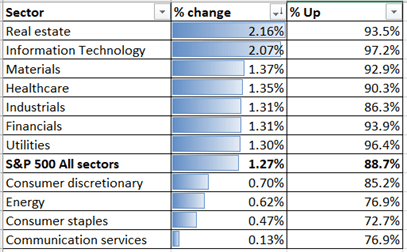
Source: Bloomberg, DailyFX
Technically,the Nasdaq 100 has found a strong support at 11,070 - the 23.6% Fibonacci retracement - and has since rebounded (chart below). Holding above this level may pave way for further upside towards the immediate resistance level of 11,660 – the 20-Day Simple Moving Average (SMA). The RSI indicator has retraced back to neutral levels from an overbought territory above 70.0. This suggests that near-term selling pressure is fading.
Nasdaq 100 Index – Daily Chart

ASX 200 Index Outlook:
Positive sentiment from the Wall Street overnight may lift Australian stocks, which have already registered decent gains on Monday. Today’s Chinese data is likely to set the tone for ASX 200 trading in the mid-day. It may also spook some volatility in AUD/USD pair, which has been ranging within a tight zone between 0.725 to 0.730 recently.
Technically, the ASX 200 index has found a strong support at 5,850 and has since rebounded (chart below). The MACD indicator is likely to form a “Bullish Crossover” if the index continues to climb in the days to come.
ASX 200 Index – Daily Chart

Straits Times Index Outlook:
Singapore’s Straits Times Index (STI) failed to follow the broader market rally on Monday and closed marginally lower on Monday. STI’s performance this year is largely lagging behind its global peers, perhaps due to poor fundamentals and a lack of technology players. Its relatively cheap valuation, however, may serve to cushion the downside.
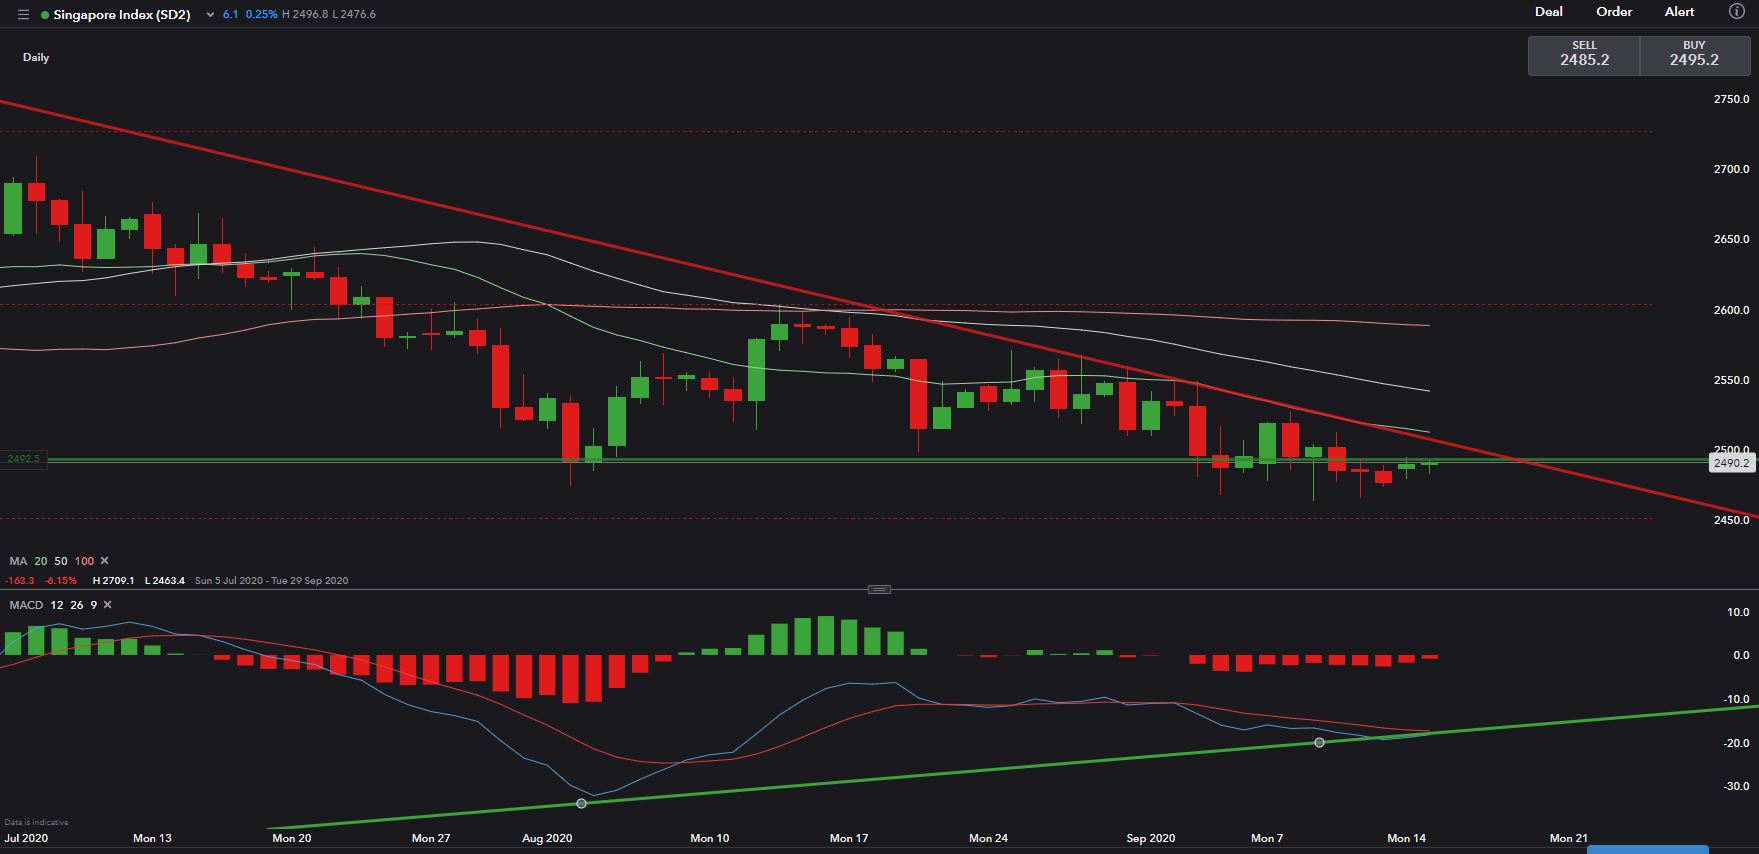
Technically, the STI has found a strong support at around 2,500. It has formed a “Descending Triangle” on the daily chart, trending lower since early June. The MACD indicator, however, has likely formed a bullish “MACDConvergence” as the MACD formed “higher lows” while stock prices drifted lower. The STI needs some positive catalysts to attempt for a meaningful breakout.
Straits Times Index – Daily Chart

--- Written by Margaret Yang, Strategist for DailyFX.com
To contact Margaret, use the Comments section below or @margaretyjy on Twitter


