


Dow Jones Price Outlook:
- The Dow Jones suffered losses to start the week as a selloff that began in big-tech spread
- Stock-specific losses helped drag down the Dow Jones while the Nasdaq 100 suffered deeper declines
- Nasdaq 100, DAX 30, CAC 40 & Nikkei 225 Forecasts for the Week Ahead
Dow Jones Forecast: Industrial Average Succumbs to Selling Pressures
The Dow Jones suffered another day of declines as selling pressures extended from high-flying tech stocks to some key Industrial Average members. While Apple and Microsoft continued to be weak spots, a fresh FIA investigation into the 787 Dreamliner placed Boeing in the spotlight, seeing it suffer similar declines. Together, weakness in some leading technology members and a key blue chip member has seen the DJIA fall to an ascending trendline for support.
Dow Jones Price Chart: 4 - Hour Time Frame (April 2020 – September 2020)
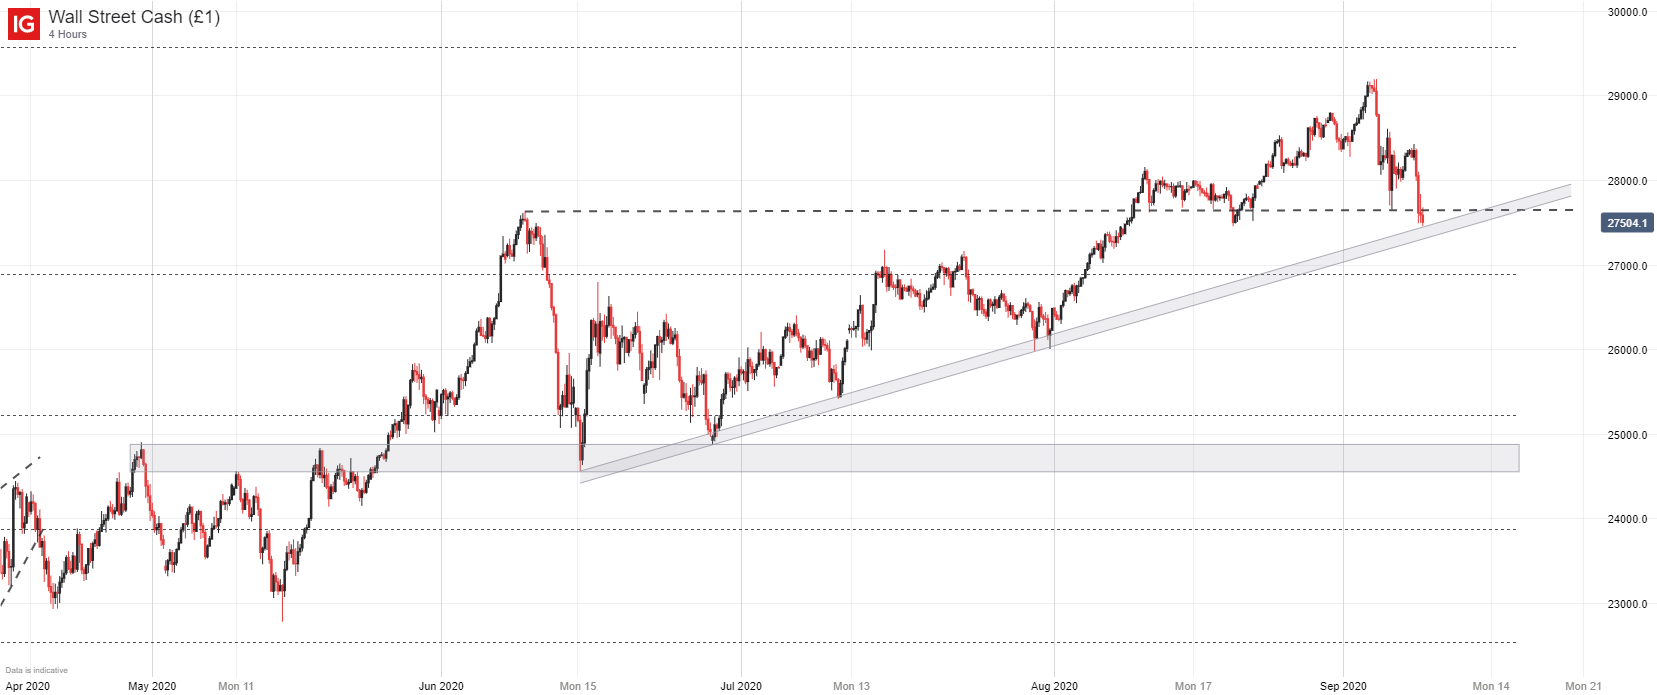
Suffice it to say, the Dow Jones may be at a crossroads near 27,400 where another red session could see a technical breach allow for a continued extension lower. On the other hand, a successful recovery at this juncture could see the Dow attempt to claw back recent losses. Either way, the Dow will have to negotiate continued tech weakness as there has been little indication FANGMAN members have regained investor confidence.
A Guide to Support and Resistance Trading
With that in mind, the Dow Jones appears vulnerable to further declines, but the Nasdaq 100 should continue to outpace the Industrial Average. Therefore, looking to capitalize on the potential divergence between the US indices could create trading opportunities in the shorter-term.
| Change in | Longs | Shorts | OI |
| Daily | -18% | 18% | 7% |
| Weekly | -19% | 14% | 4% |
As September progresses, stocks may continue to exhibit weakness which has now broadened to commodities like crude oil. In the meantime, follow @PeterHanksFX on Twitter for updates and analysis.
--Written by Peter Hanks, Strategist for DailyFX.com
Contact and follow Peter on Twitter @PeterHanksFX


