Japanese Yen, Abenomics, Bank of Japan, AUD/JPY, USD/JPY – Talking Points:
- Accommodative monetary policy setting likely to endure despite Japanese Prime Minister Shinzo Abe’s shock resignation
- AUD/JPY rates eyeing multi-year highs after surging through Ascending Triangle resistance.
- USD/JPY rates at risk of sliding lower as price struggles to overcome the trend-defining 50-day moving average.
Abenomics Here to Stay
Although Japanese Prime Minister Shinzo Abe’s time may be coming to an end, his multi-pronged economic program known as ‘Abenomics’ seems here to stay for the foreseeable future. Abe’s likely successor – Chief Cabinet Secretary Yoshihide Suga – stated that he wants to “inherit the current framework” and is “highly appreciative” of the Bank of Japan’s current approach to monetary policy.
This may soothe regional investor’s concerns and weigh on the haven-associated Japanese Yen, after BoJ Deputy Governor Wakatabe Masazumi stressed that due to the “high uncertainties over the impact of COVID-19 on economic activity and prices, the Bank will closely monitor the impact and will not hesitate to take additional easing measures if necessary”.
Moreover, Masazumi flagged that “it is necessary to constantly have deep discussions in order to improve monetary policy” and highlighted the Federal Reserve’s adoption of “average inflation targeting” as an example of adjustments made to “enhance the effectiveness of monetary policy”.


Therefore, with Japan’s consumer price index only climbing to 0.3% in July and the BoJ becoming increasingly more “vigilant against the risk of a decline in the inflation rate”, accommodative monetary policy settings look set to endure.
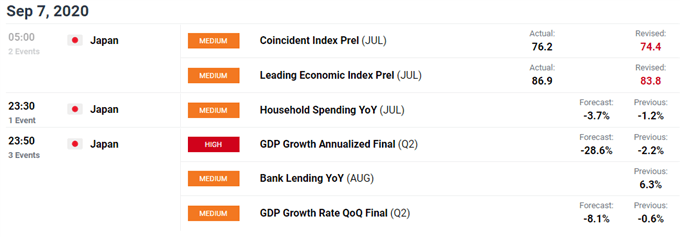
To that end, upcoming second quarter GDP and household spending figures for July may force the hand of local policymakers, with disappointing data likely stoking the BoJ’s need to do more to support the nascent economic recovery and in turn dampening the performance of the Japanese Yen.

DailyFX Economic Calendar
AUD/JPY Daily Chart – Ascending Triangle Break Hints at Extended Gains
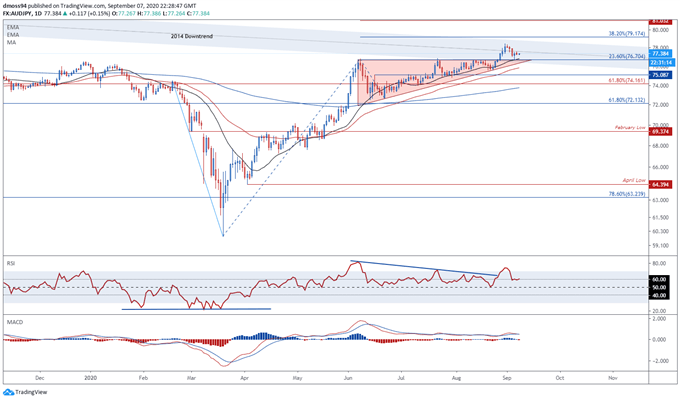
As noted previously, the impulsive surge through Ascending Triangle resistance on August 27 signals that an extended topside move may be on the cards for AUD/JPY rates and could see price push above the psychologically pivotal 81 level to fulfil the implied measured move (81.032).
Despite failing to successfully overcome the 38.2% Fibonacci (79.17), the path of least resistance remains skewed to the upside if price remains constructively perched above former resistance-turned-support at the 23.6% Fibonacci (76.70).
A daily close above the August high (78.46) is probably needed to signal the resumption of the primary uptrend and would likely carve a path for price to test key resistance at the 38.2% Fibonacci (79.17) and 80 level.
Conversely, a break below mobile support at the 21-day moving average (76.83) could invigorate selling pressure and potentially lead to a sustained correction back towards the sentiment-defining 200-DMA (73.77).

AUD/JPY daily chart created using TradingView
| Change in | Longs | Shorts | OI |
| Daily | 0% | 11% | 5% |
| Weekly | 29% | -25% | -3% |
USD/JPY Daily Chart – Descending Channel Guiding Price Lower
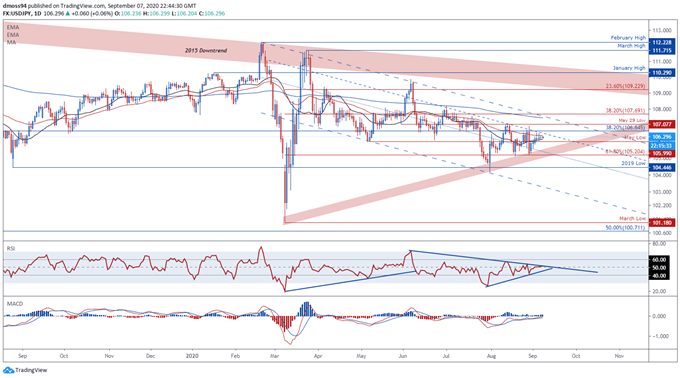
USD/JPY’s tepid 7-day rally is at risk of breaking down as price struggles to break above the trend-defining 50-DMA (106.35) and continues to travel within the confines of a bearish Descending Channel.
The development of the RSI hints at fading bullish momentum as it struggles to snap the downtrend extending from the June high and fails to convincingly climb above its neutral midpoint.
Moreover, a series of Doji candles over the last few days of trade may be indicative of uptrend exhaustion and could inspire would-be sellers if price slides back below the 21-DMA (106.14).
With that in mind, a daily close below the May low (105.99) would probably generate a pullback to confluent support at the 61.8% Fibonacci (105.20) and March uptrend.
Conversely, a break above the May 29 swing-low (107.08) could stoke buying pressure and ignite a bullish surge to test the 200-DMA (107.45) and Descending Channel resistance.

USD/JPY daily chart created using TradingView
| Change in | Longs | Shorts | OI |
| Daily | -2% | 2% | 0% |
| Weekly | 12% | -16% | -6% |
-- Written by Daniel Moss, Analyst for DailyFX
Follow me on Twitter @DanielGMoss


