


USD/CAD Forecast:
- Loonie clings to Fibonacci support
- MACD crossover provides hope for the bulls
- USD/CAD remains below 50-period moving average
Loonie Retreats Off Key Fibonacci Support
The recent sell-off in the greenback has seen the US Dollar struggling to maintain ground amongst its major counterparts as concerns surrounding low interest rates, ongoing US-China trade wars and the upcoming presidential election, all weigh in on the Dollar. Now, after 8 consecutive weeks of losses, the pair has now fallen into a critical level of support, with price action temporarily stalling at this level. Now, with Canadian PMI showing signs of a strong economic rebound, technical analysis indicates that, at present, price action may be conflicted so long as this level holds.
Visit the DailyFX Educational Center to explore the basics of Technical Analysis and more
The USD/CAD weekly chart below, highlights the Fibonacci Retracement levels from two major moves. The first Fibonacci retracement (pink), represents the primary move between the January 2002 and the November 2007 low, while the second Fibonacci retracement (purple), is plotted between the September 2017 low and the March 2020 high.
Since rebounding off of the March 2020 highs, the strong correction towards the downside has pertained, up until the current support level of 1.30608, the 61.8% retracement level of the primary move, came into play.
USD/CAD Weekly Chart
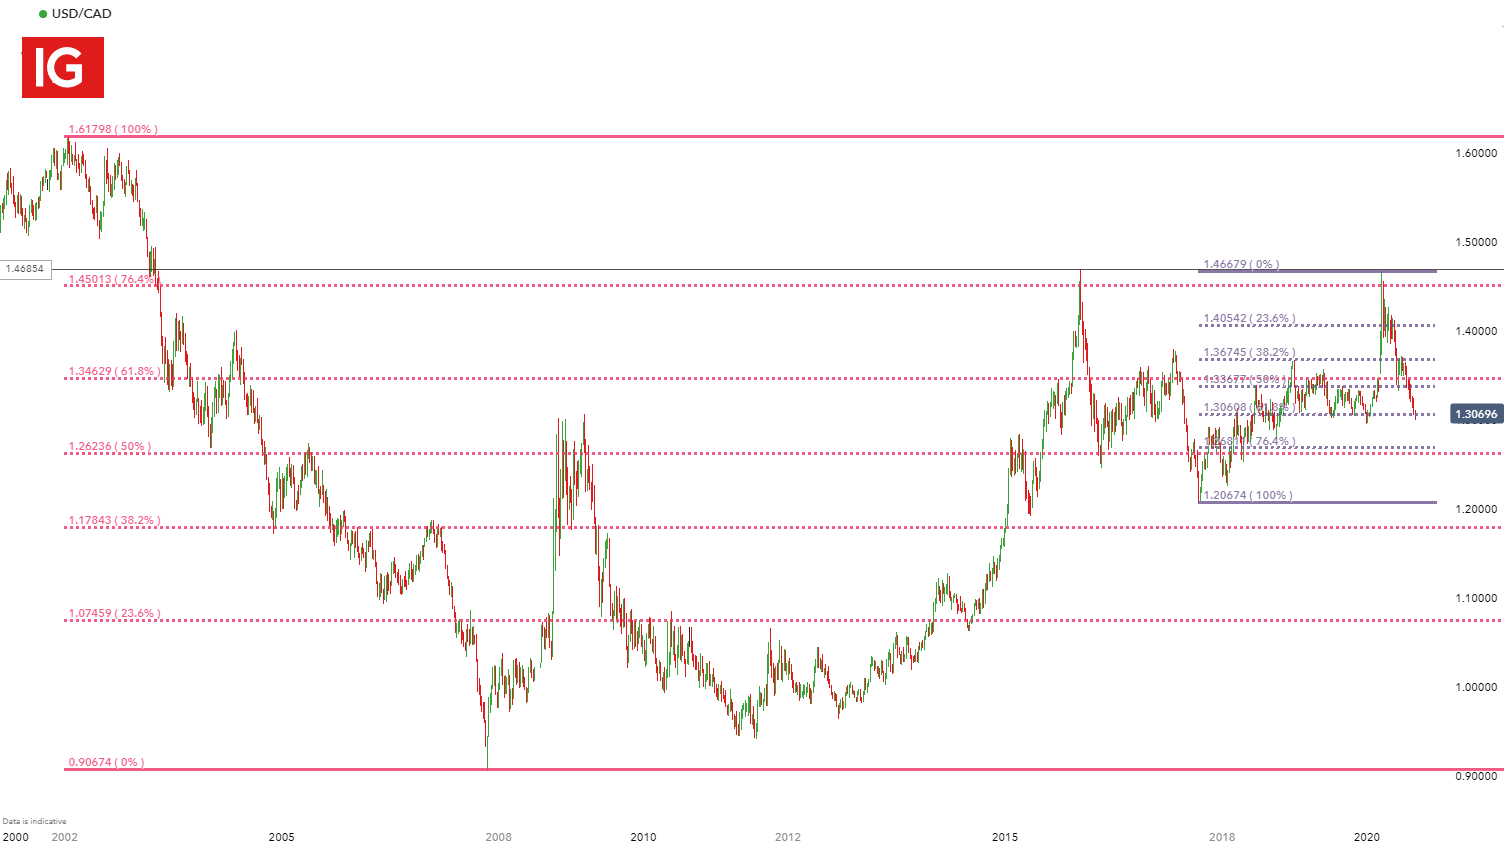
Chart prepared by Tammy Da Costa, IG
MACD Crossover – Potential Relief for Bulls
From a short-term perspective, on the four-hour chart below, the Moving Average Convergence/Divergence (MACD), which measures the momentum and direction of the trend, has crossed upward, below the zero line, a possible indication that the trend may reverse towards the upside. However, prices remain below the 50-period moving average, indicating that the trend is still favoring the bears, for now.

USD/CAD Four-Hour Chart

Chart prepared by Tammy Da Costa, IG
Moving Ahead
For now, as long as the current support level holds, a bullish continuation cannot be ruled out.A break above 1.306 could see price action favoring the bulls with 1.13677, the 50% retracement of the short-term move holding as resistance. Meanwhile, a break below, could see the 76.4% retracement level forming as support at 1.26811.
Client Sentiment
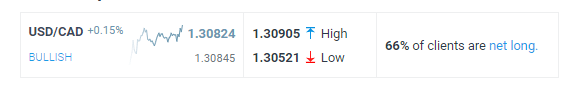

IGCS shows that, at the time of writing, USD/CAD client sentiment remains bullish, with 66% of retail traders holding long positions. We typically take a contrarian view to crowd sentiment and the fact that clients are net long, suggests that prices may continue to fall.
--- Written by Tammy Da Costa, Market Writer for DailyFX.com
Contact and follow Tammy on Twitter: @Tams707


