


GBP price, news and analysis:
- GBP/USD has fallen back after almost touching 1.35 Tuesday, hitting a high of 1.3483.
- However, it remains in a good position to challenge the psychological resistance at that 1.35 level, perhaps later this week.
- UK house prices jumped to a new high in August, according to the Nationwide Building Society.
GBP/USD eases, still targets 1.35
GBP/USD has fallen in early European business Wednesday after almost reaching “round-number” resistance at 1.35 Tuesday, hitting 1.3483. However, the pullback could well be followed, perhaps later this week, by a new attempt to reach 1.35 and the highs just above it recorded in mid-December last year.
GBP/USD Price Chart, 15-Minute Timeframe (September 1-2, 2020)
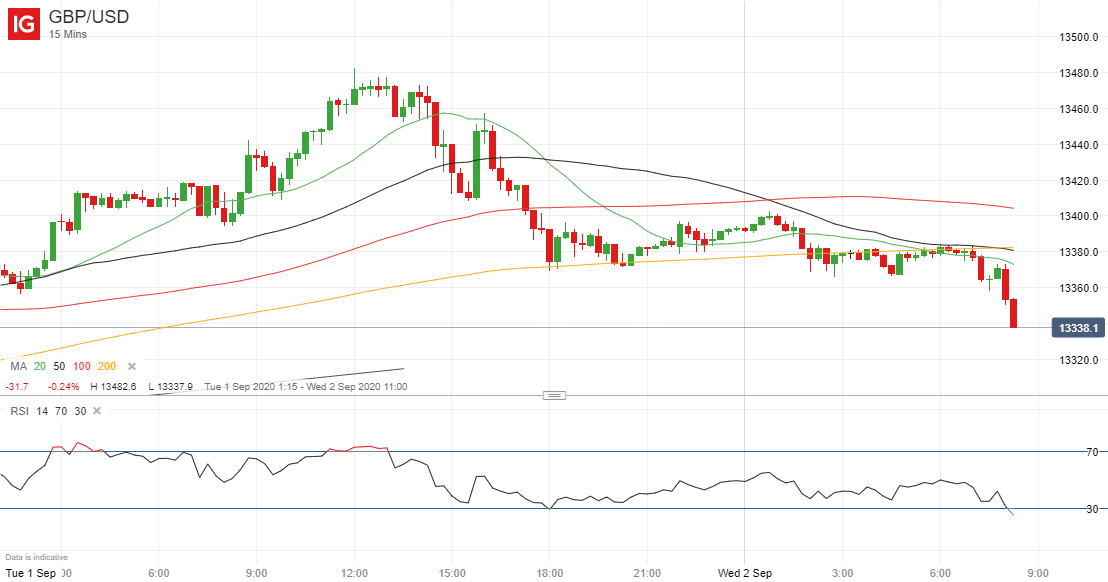
Chart by IG (You can click on it for a larger image)
| Change in | Longs | Shorts | OI |
| Daily | 3% | -7% | -3% |
| Weekly | 4% | -10% | -5% |
As in previous days, the currency markets are still dominated by hopes of more fiscal and monetary stimulus in the US to ease the economic pain of the coronavirus pandemic despite news Tuesday of a sharper than expected increase in the US ISM manufacturing index.
That news helped USD to rally after reaching is lowest level Tuesday since April 2018, weakening pairs such as GBP/USD, EUR/USD and AUD/USD.
UK house prices jump
In the UK, meanwhile, data released Wednesday showed the Nationwide House Price Index hit a new all-time high in August. Prices jumped by 2.0% from July and Nationwide’s chief economist noted that UK house prices have now reversed the losses recorded in May and June as the Covid-19 lockdown has prompted people to rethink the kind of home they want to live in, as well as creating pent-up demand.

We look at currencies regularly in the DailyFX Trading Global Markets Decoded podcasts that you can find here on Apple or wherever you go for your podcasts
--- Written by Martin Essex, Analyst
Feel free to contact me on Twitter @MartinSEssex


