


S&P 500 Forecast:
- The S&P 500, Dow Jones and Nasdaq 100 enjoyed successful sessions as each drove higher
- Apple continues to be a major source of strength for all three indices
- Difference between Dow, Nasdaq, and S&P 500: Major Facts & Opportunities
S&P 500 Price Outlook: Apple Leads Index to New Highs With Confidence
The S&P 500 extended its recovery rally beyond pre-covid levels on Monday after surging more than 1% to claim new record territory. Many financial news outlets attributed the move to upbeat virus news and in anticipation of the Jackson Hole symposium, but assigning such price action to single events directly is rather presumptuous.
Apple Drags S&P 500 Higher: Hourly Price Chart (May 2020 – August 2020)
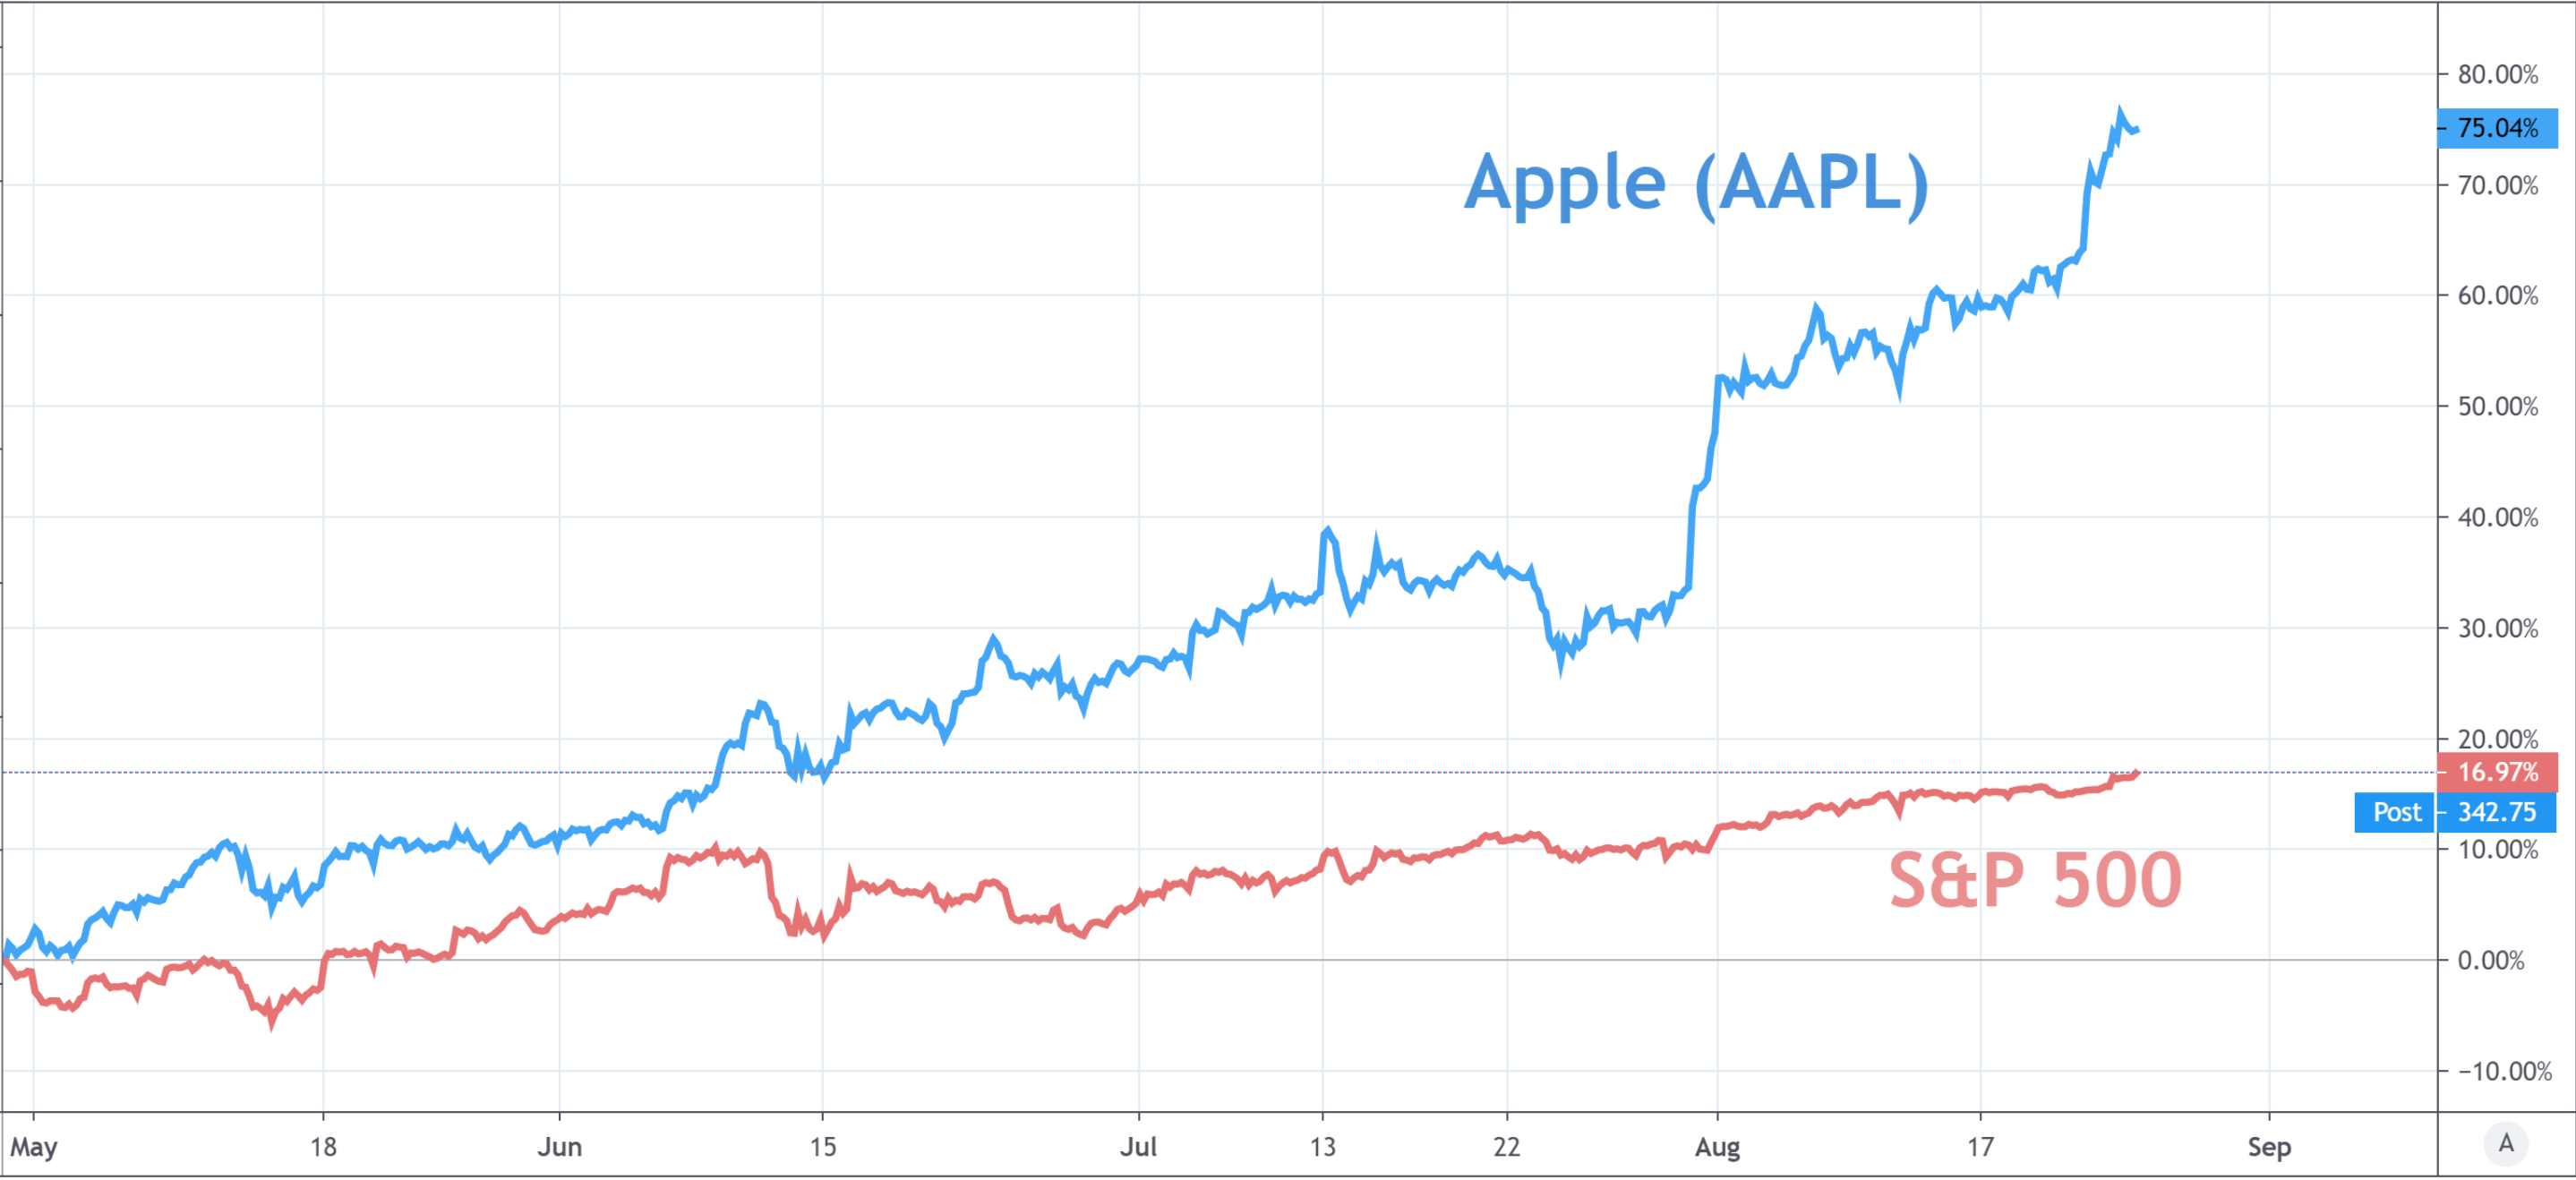
To be sure, the emergency authorization of convalescent plasma to treat coronavirus likely played a role in stoking bullish sentiment, but notable outperformance from stocks like Apple could suggest Monday’s price action was more of the same strength from big technology names, rather than a swell in demand for the entire index. To that end, Apple began the session with a notable gap higher before slowly forfeiting gains as the session progressed.

Nevertheless, the iPhone-maker finished the session 1.2% higher than it closed Friday. Apple was a key theme highlighted in our weekly equity forecast and it has already shown an appetite to continue its recent surge – which has progressed regardless of broader market performance or fundamental catalysts. Thus, I would attribute some of the bullish break higher to continued outperformance from the index’s largest component instead of a fundamental shift in equity demand on virus news.
S&P 500 Price Chart: Daily Time Frame (January 2020 – August 2020)
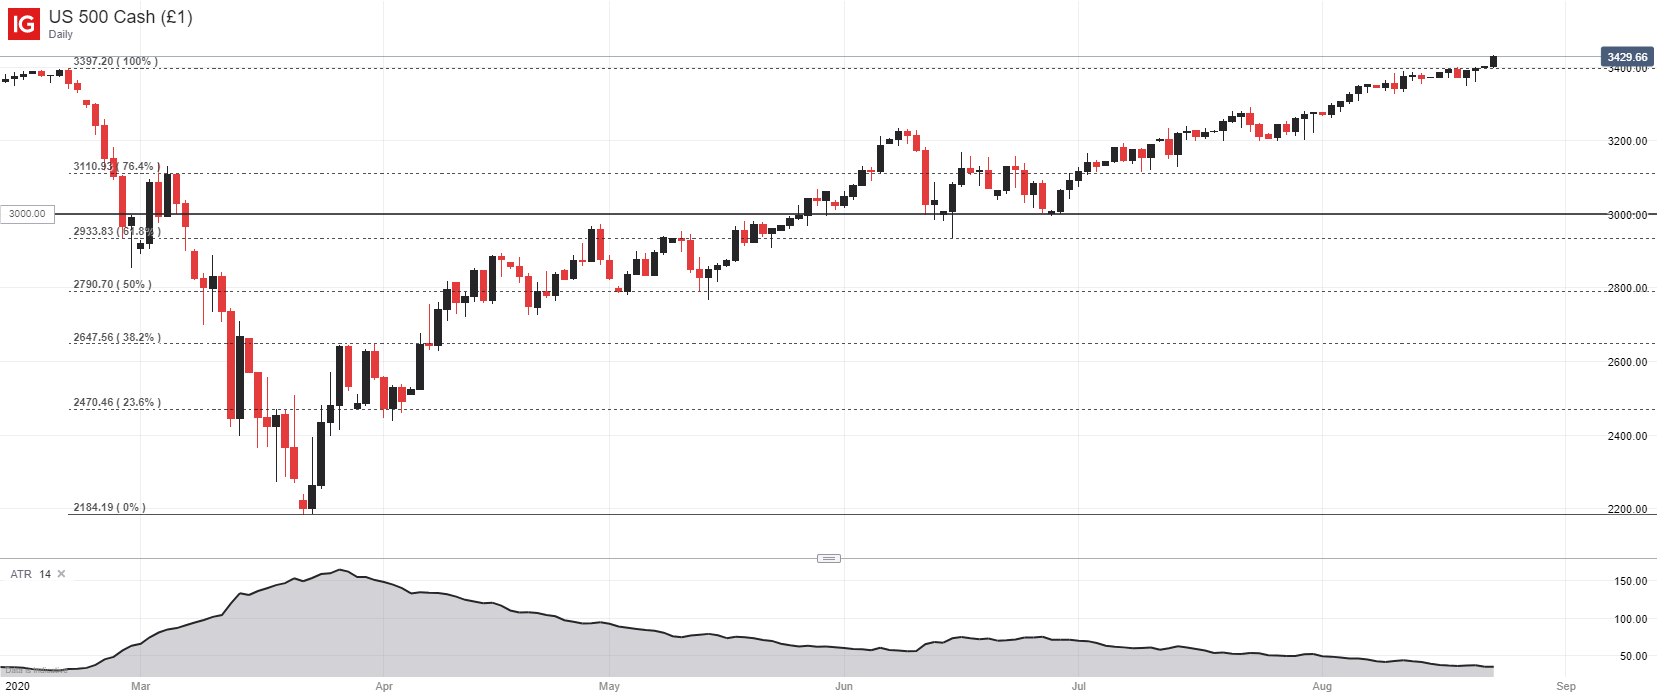
Either way, the S&P 500 enjoyed a technical milestone as it confidentially established price action above resistance offered by prior highs around 3,400. While price activity has slowed in recent weeks, partially due to summer trading conditions, Monday’s break has opened the door for a possible continuation higher. Still, traders will have to overcome the summer doldrums and a looming Jackson Hole symposium if the rally is to continue at this pace.
| Change in | Longs | Shorts | OI |
| Daily | 1% | -1% | 0% |
| Weekly | 15% | -13% | -1% |
That said, it seems the foundation for another leg higher has been laid, but seasonality may work against such a move. As bulls and bears hash it out in the market, follow @PeterHanksFX on Twitter for updates and analysis.
--Written by Peter Hanks, Strategist for DailyFX.com
Contact and follow Peter on Twitter @PeterHanksFX


