


AUD/USD & ASX 200 Price Outlook:
- AUD/USD has surpassed its pre-covid levels, suggesting recent gains could be on the back of USD weakness
- The ASX 200 has encountered significant resistance around the 6,185 level that could stall gains, but presents a possible break out opportunity
- Still, the precarious state of risk appetite leaves both AUD/USD and the ASX 200 vulnerable
AUD/USD & ASX 200 Forecast: Can Aussie Stocks Break Higher?
AUD/USD and the ASX 200 have witnessed unequal recoveries since the covid crash, with the currency pair establishing gains well above February levels while the equity market remains ensnared at resistance. While both share a notable correlation with US indices, the current state of the two Aussie markets reveals the Dow Jones and AUD/USD are more in tune than that of the Dow and ASX, leaving the latter with some catching up to do.
AUD/USD & Dow Jones Price Chart: Year-to-Date

Source: Bloomberg, John Kicklighter
That said, the Australian equity index has approached notable resistance at the 6,185 mark which has helped stall prior attempts higher. As other risk assets continue their extensions, a bullish break above resistance for the ASX 200 could open the door for a continuation of its own and a possible break out trade, a move that could see the index close the gap to other risk assets.
ASX 200 Price Chart: 4 – Hour Time Frame (February 2020 – August 2020)
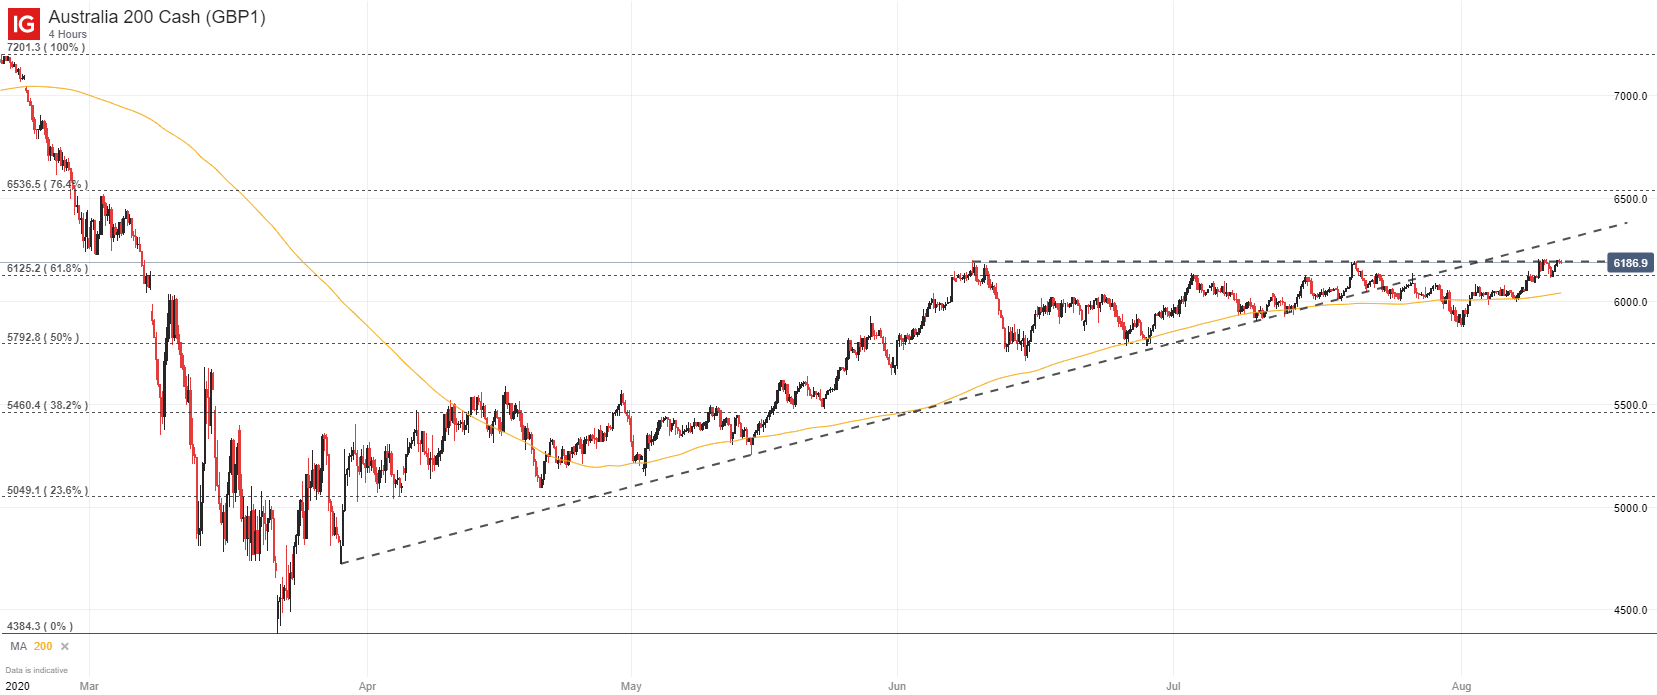
To that end, a potential break out trade could consider levels of invalidation slightly beneath the nearby Fibonacci level at 6,125, while aiming for areas of interest above. While there is little to suggest a break out is imminent, or that the ASX 200 will ever catch up to other risk assets, the current risk-reward landscape is attractive for a possible break out opportunity.
Becoming a Better Trader – Maximizing Breakout and Pullback Strategies
Therefore, a bullish breakthrough of 6,185 would be an encouraging development for a longer-term continuation higher. Still, sudden shifts in risk appetite – as evidenced by Tuesday’s US equity selloff – could erode both AUD/USD and the ASX 200 at a moment’s notice. In the meantime, follow @PeterHanksFX on Twitter for updates and analysis and check out our guide to trading break outs.

--Written by Peter Hanks, Strategist for DailyFX.com
Contact and follow Peter on Twitter @PeterHanksFX


