


FTSE 100 Price Outlook:
- Upcoming UK GDP data could stoke FTSE 100 volatility as the index bleeds lower
- That said, price may react rather unimpressively amid a broader decline in volatility which might make the index a prime candidate for range trading opportunities
- Either way, recent price action has created a worrisome trend for the equity index as GBP/USD treads higher
FTSE 100 Forecast for the Week Ahead: Key Data Due as Momentum Fades
The FTSE 100 could enjoy a dose of volatility this week amid an otherwise calm month of August as key growth data from the United Kingdom is due. As with most of the world, coronavirus has hobbled the UK economy, thus affording economic activity metrics a crucial role in equity performance. With that in mind, traders and investors should keep a close watch on the upcoming release and subsequent price reaction as the FTSE 100 begins to show bullish momentum has exited the index.
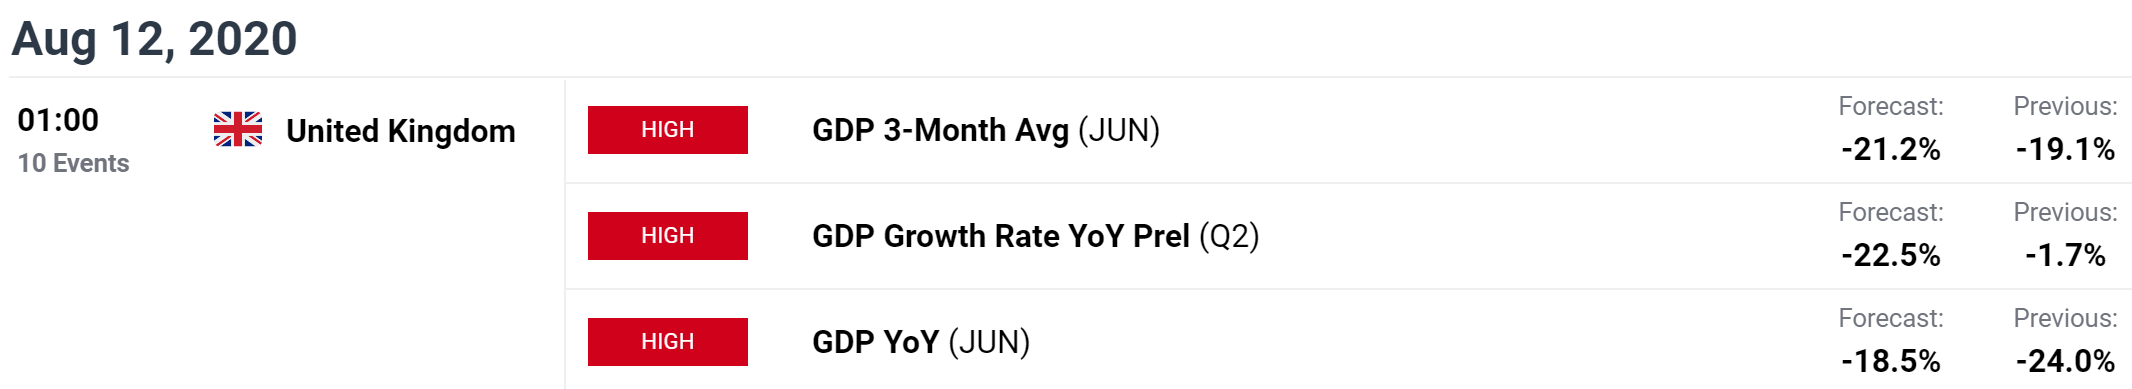
Source: DailyFX Economic Calendar
Therefore, the importance of the data could serve to accelerate losses if a poor result is realized, or perhaps slow the descent if growth has recovered quicker than expected. That being said, there is little to suggest the print will immediately spark a drastic increase in volatility as a broader decline in volatility has gripped markets amid the height of the summer doldrums. In any case, if a scheduled event were to revive bullish appetite for the FTSE 100, GDP data may be the most likely.
FTSE 100 Price Chart: 1 – Hour Time Frame (June 2020 – August 2020)
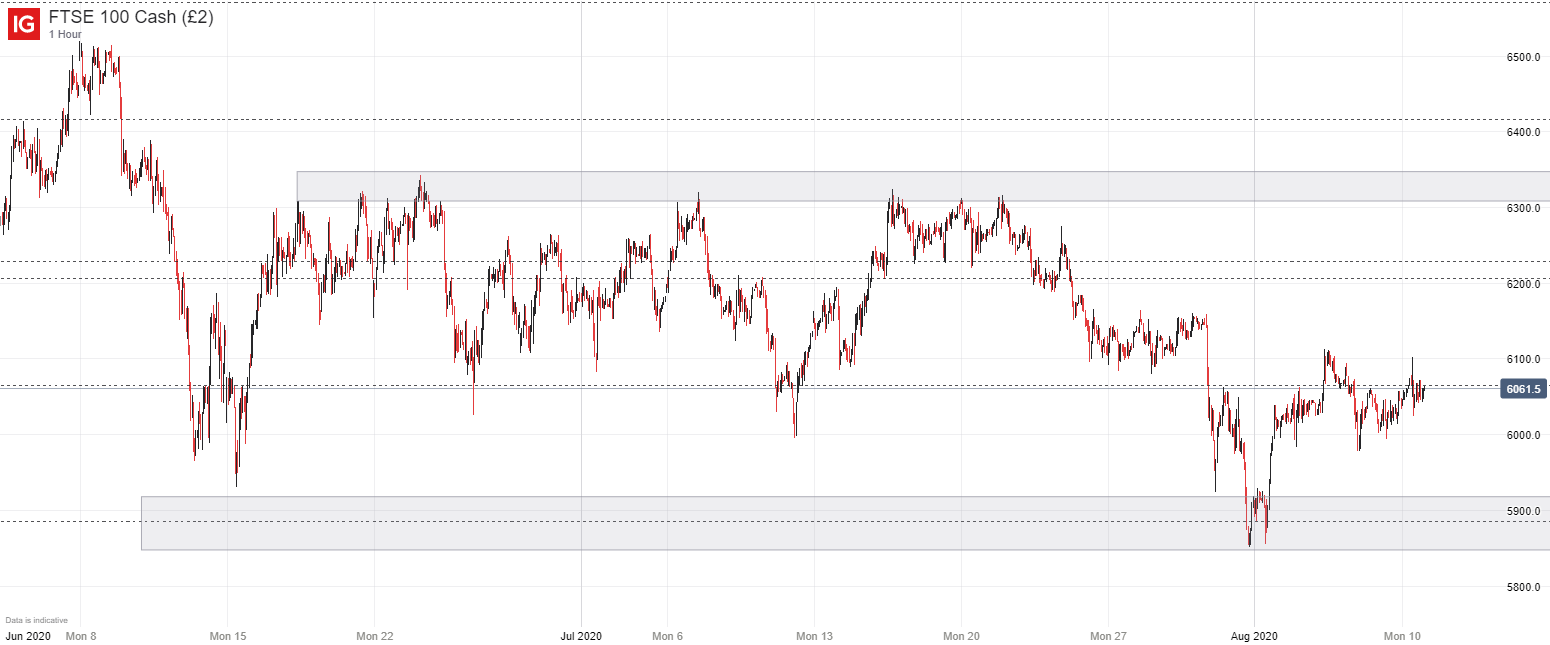
To that end, key technical levels should be outlined prior to the event in case of a notable reaction. Weeks of indecision has seen the FTSE 100 slip into a quiet trading range, effectively bouncing between resistance around the 6,300 mark and support just south of 5,900.
FTSE 100 Price Chart: 4 – Hour Time Frame (March 2020 – August 2020)
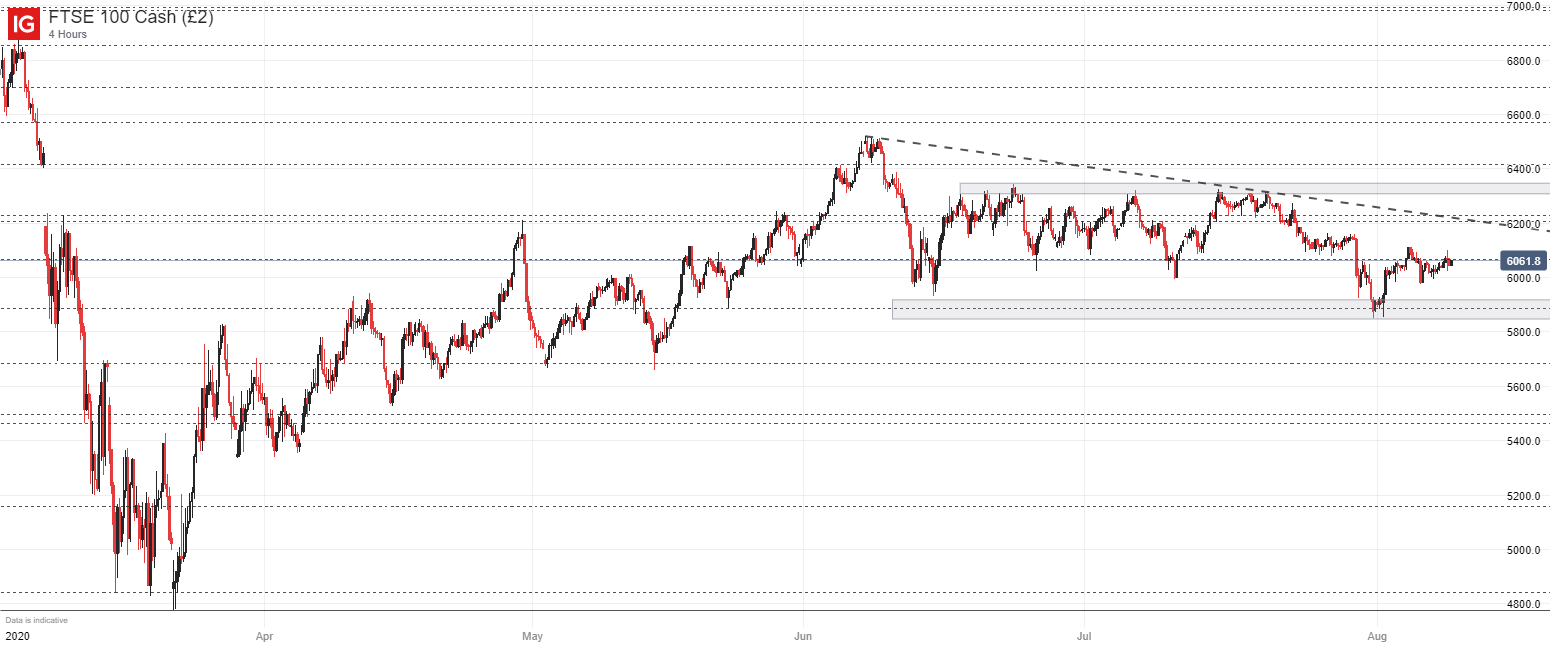
While I am hesitant to suggest the upcoming data will spark a break out in either direction, it could fuel further losses that have begun to pile up after weeks of fading bullish momentum. Therefore, the FTSE 100 appears to be a rather weak candidate for break out trading strategies, but could prove enticing for range traders. In the meantime, follow @PeterHanksFX on Twitter for earnings updates and analysis as they arrive.
--Written by Peter Hanks, Strategist for DailyFX.com
Contact and follow Peter on Twitter @PeterHanksFX


