


USD/JPY Analysis:
- Since breaking below the crucial 106.00 level, USD/JPY has posted a V-shaped near- term recovery
- The pair trades higher as the US dollar attempts to mount a comeback after nearly two weeks of losses in the lead up to Non-Farm Payroll data later this week.
- IG Client Sentiment data reveals that 62% of traders are net long, with a sizeable reduction in weekly shorts
USD/JPY: Near-Term V-Shaped Recovery as USD Attempts to Halt Recent Losses
The Japanese Yen, while experiencing bouts of sharp advances and declines, has created a series of lower highs (down sloping trendline resistance) and had printed a near term low of 104.91 last Friday, following a breakdown of the 106.00 level.
However, a resurgence in the global reserve currency has seen price trade off the recent low and is now testing the key 106 level once more, this time as resistance.
USD/JPY Daily Chart: Trading Near the Key 106.00 Level

Chart prepared by Richard Snow, IG
USD/JPY Strategy Going Forward
The pair is currently poised near the bottom of the previous trading range and near the 50 level on the RSI – providing little directional information for traders. Future price action confirming either a break above or a failure to hold above 106.00 is likely to reveal where the pair may head next.
If the recent bullish move continues and results in a break and close of 106.00, USD/JPY bears may look to the downward-sloping trendline as this presents potential near-term resistance. A continued move above this trendline brings into focus the next area of significant resistance around 107.70 - 108.00 (yellow bar).
USD/JPY bears however, may begin to eye the 104.50 level (yellow line) should price fail to break and close above 106.00. Further downside momentum may bring the recent low of 104.19 into play.
USDJPY Daily Chart: Key Trading Levels
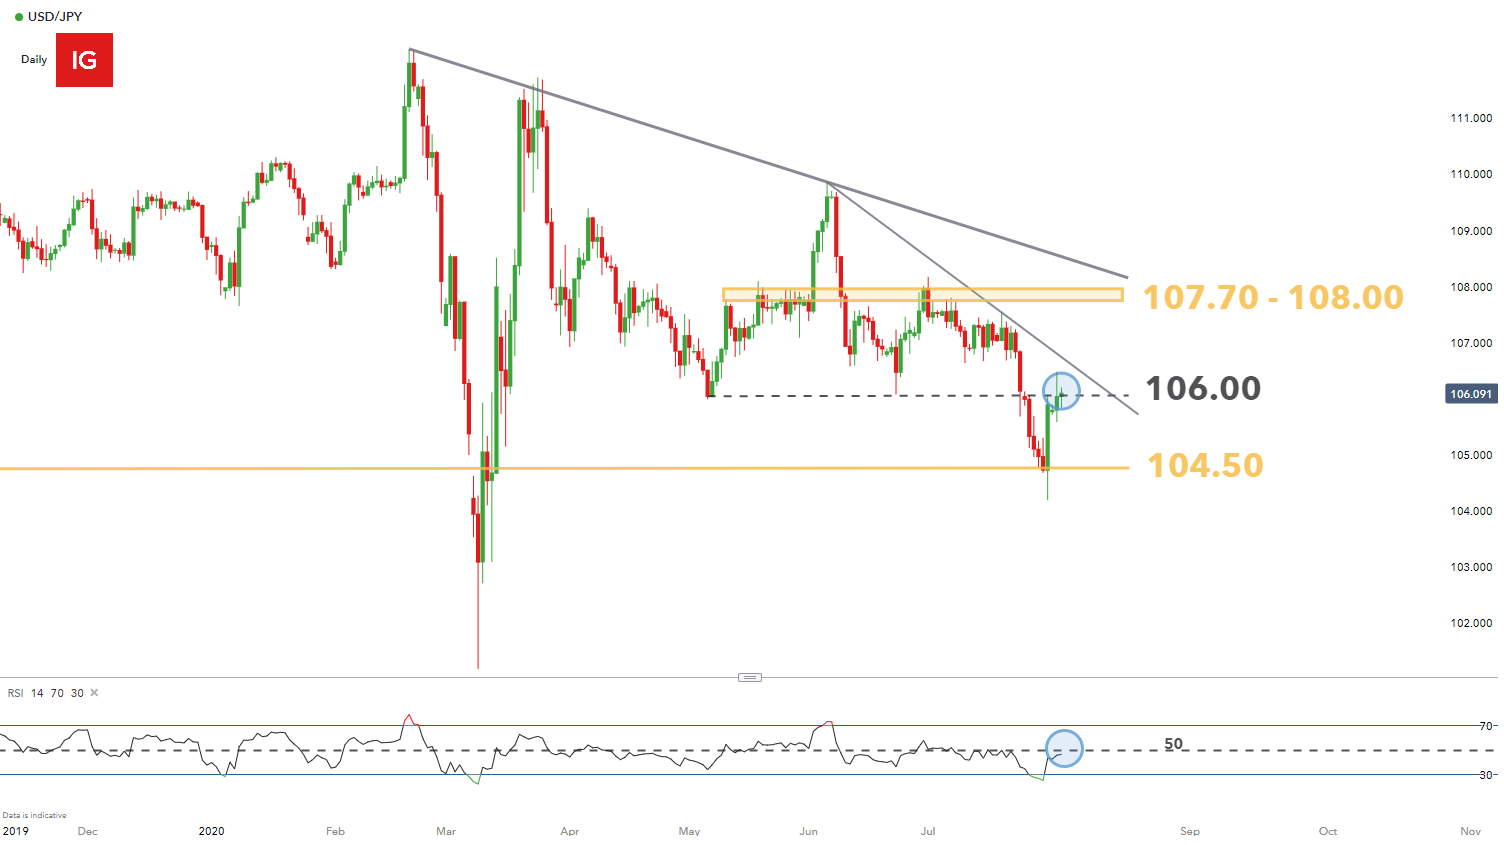
Chart prepared by Richard Snow, IG
USD/JPY Sentiment Data Reveals Contrarian Outlook
- At the time of writing, USD/JPY retail trader data shows 62.04% of traders are net-long with the ratio of traders long to short at 1.63 to 1.
- When operating with a contrarian view with respect to IG Client Sentiment, the fact traders are net-long suggests USD/JPY prices may continue to fall.
| Change in | Longs | Shorts | OI |
| Daily | -2% | 2% | 0% |
| Weekly | 12% | -16% | -6% |
- The number of traders net-long is 6.74% higher than yesterday and 6.89% higher from last week, while the number of traders net-short is 4.95% higher than yesterday and 13.98% lower from last week.
- Positioning is less net-long than yesterday but more net-long from last week. The combination of current sentiment and recent changes gives us a further USD/JPY bearish contrarian trading bias.
--- Written by Richard Snow for DailyFX.com
Contact and follow Richard on Twitter: @RichardSnowFX


