


Dow Jones, S&P 500, Shanghai Composite, Straits Times – Asia Pacific Indices Briefing
- Dow Jones and S&P 500 drop on Wall Street as Nasdaq gains
- Rising US coronavirus cases & deaths likely spooked investors
- Shanghai Composite may decrease, Straits Times eyes election
The majority of US equities ended in the red on Thursday in a sign of rising concerns about the outlook for growth. The Dow Jones and S&P 500 closed -1.39 percent and -0.56 percent respectively while the Nasdaq Composite recorded a +0.53 percent increase. The latter continues to speak to investors’ expectation that the tech sector can confidently ride out the storm that is surging coronavirus cases.

The world’s largest economy appears to be starting to see a spike in Covid-19 deaths. Fatalities in California increased by 149, the largest single-day jump recorded. Texas noted a record rise in deaths for three consecutive days as Florida numbers gained by 120. Demand for longer-dated Treasuries soared as the bid/cover ratio for the 30-year bond hit its highest since January at auction today.
As I have been talking about lately, the rise in local coronavirus cases have not been enough to materially dent the outlook for 2021 GDP. This also means the same for measures states and counties have taken thus far to pause lockdown-easing efforts. With that in mind, this could change if Covid-19 fatalities continue climbing and perhaps this is what the markets started to price in, slowly.
Discover your trading personality to help find optimal forms of analyzing financial markets
Dow Jones Technical Analysis
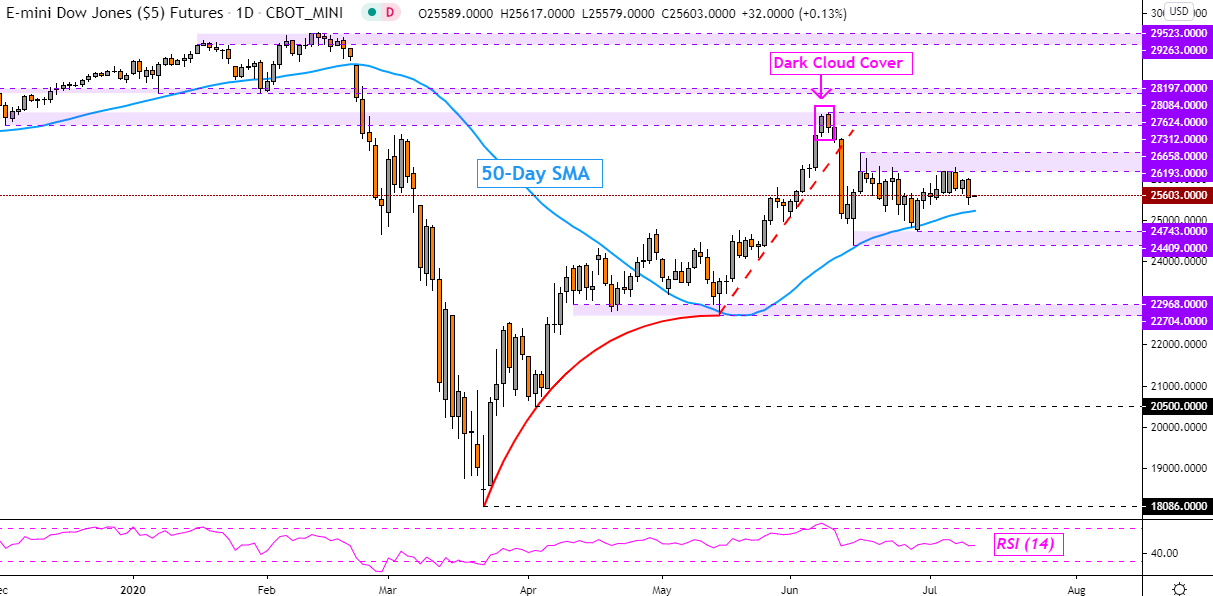
Dow Jones futures closed at the lowest in a week after the index rejected key resistance between 26193 and 26658. This leaves it once again facing the 50-day simple moving average (SMA) below. In late June, the Dow Jones bounced off the 50-day SMA and it may do so once again. Regardless, below the SMA sits key support which is a range between 24409 and 24743.
| Change in | Longs | Shorts | OI |
| Daily | -17% | 10% | -3% |
| Weekly | 16% | -5% | 3% |
Dow Jones – Daily Chart
Friday’s Asia Pacific Trading Session
With that in mind, Asia Pacific equities could echo the broad ‘risk-off’ tone set on Wall Street. However, US second quarter earnings season is about to take off starting next week with a slew of financial companies and industrial businesses like Alcoa reporting. This is where stock valuations will be heavily scrutinized, particularly around the tech sector which arguably has a high bar to meet in the current environment.
This could leave financial markets in a consolidative setting, especially given that most key data for this week has past. The Shanghai Composite is awaiting Chinese aggregate financing data, which may cross the wires somewhere between today and July 15. Singapore’s benchmark Straits Time index has today’s general election to await. A 15th consecutive term for the People’s Action Party (PAP) may keep volatility at bay.
Straits Times Technical Analysis
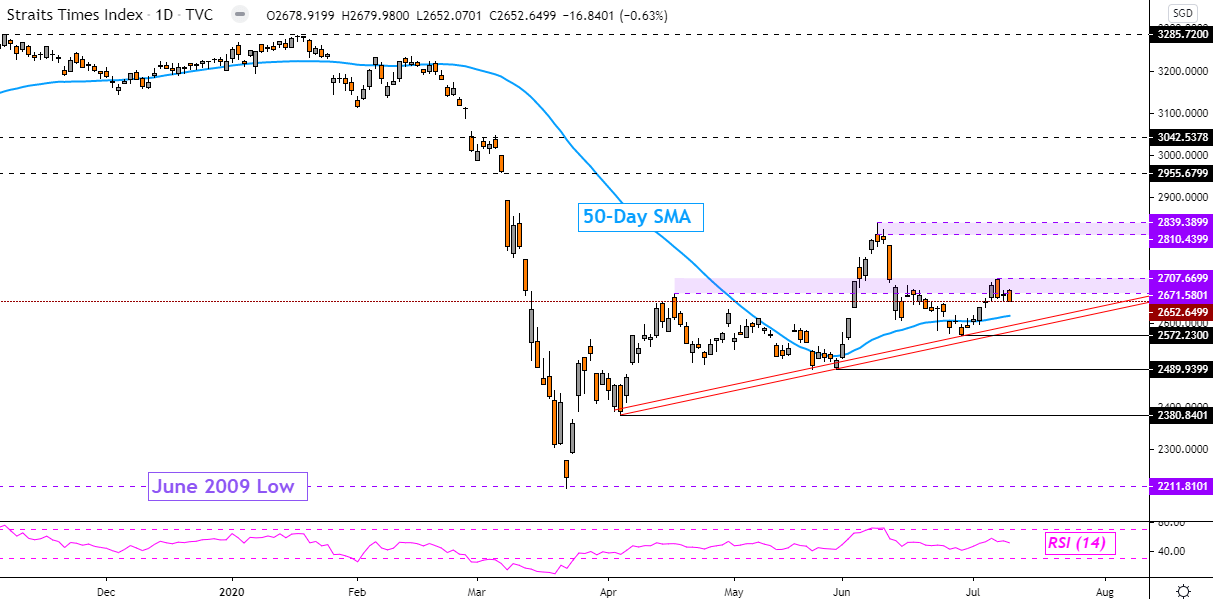
The Straits Times rejected the 2671 – 2707 inflection range, perhaps setting it on course to test the 50-day SMA – blue line on the daily chart below. Below this technical barrier seems to be rising support from April – red lines. A daily close under 2572 could open the door to resuming the top from early June. Otherwise, a push above immediate resistance exposes the 2810 – 2839 barrier.
Interested in the Singapore Dollar, USD/SGD? Check out my latest ASEAN technical outlook !
Straits Times Index – Daily Chart
--- Written by Daniel Dubrovsky, Currency Analyst for DailyFX.com
To contact Daniel, use the comments section below or @ddubrovskyFX on Twitter


