


.jpg)

Euro Price Analysis:
- EUR/USD spent the bulk of Q2 in a range-bound state, following a riveting outlay in Q1.
- Through the month of June, EUR/USD has repeatedly tested a confluent spot of support on the chart.
- As yet, bulls have yet to give in as prices have begun Q3 with a jump off of that zone.
EUR/USD Starts H2 from Key Chart Support
Coming into the month of June, it appeared as though a trend may begin to take hold in EUR/USD. After spending the bulk of the first two months of Q2 in a range-bound state, buyers took control while driving the pair from a low below the price of 1.0900 up to a high above the 1.1400 level. This consistent topside run made a fast approach at a huge zone of resistance; but buyers pulled up shy and prices began to pullback in the first-half of the month.
That pullback found buyers at a key point on the chart; this area runs from a batch of confluent Fibonacci levels plotted from 1.1187-1.1212. The latter of those levels is the 61.8% Fibonacci retracement of the lifetime move in EUR/USD, taking the 2001 low up to the 2008 high. The former of those levels is the 61.8% retracement of the 2017-2018 major move.
EUR/USD Four-Hour Price Chart
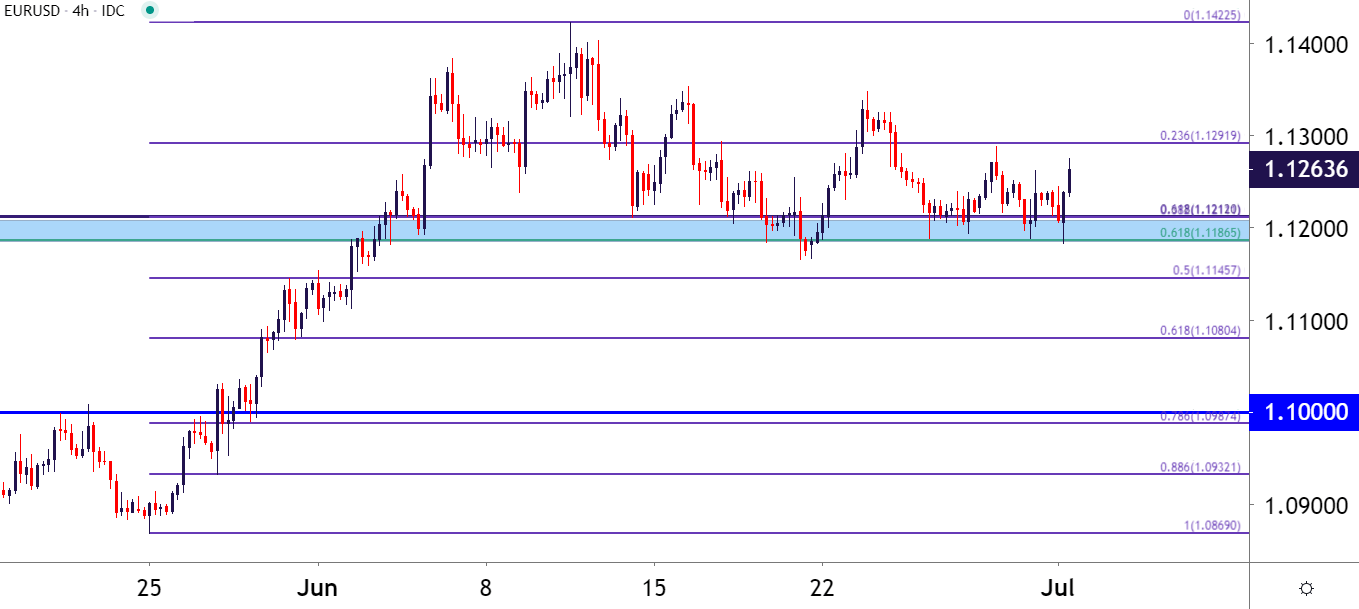
Chart prepared by James Stanley; EUR/USD on Tradingview
The big question at this point is whether buyers can take control for long enough to bring upon a re-test of the key resistance zone at 1.1448-1.1500. This zone is comprised of both the 50% marker of the 2017-2018 major move, as well as the 1.1500 psychological level that bulls didn’t want to encroach upon during the March run.

Since topping-out in early-June, EUR/USD bulls have been thwarted at a series of lower-highs; and that frequency has increased over the past week, as illustrated by a series of bearish trendlines. On the chart below are two bearish trendlines: In red, we have a trendline produced from the June 10th and June 23rd swing highs. This projection aligns with the approximate 1.1292, which would make it confluent with 23.6% retracement of the May-June major move. In maroon, however, is a shorter-term bearish trendline, that’s already being tested through with this morning’s price action; and that’s simply connecting last week’s swing high to this week’s swing high.
EUR/USD Two-Hour Price Chart

Chart prepared by James Stanley; EUR/USD on Tradingview
EUR/USD Strategy Moving Forward
As we open deeper into the second-half of the year, the big question is whether buyers can stage anything more than a short-term rally. Given the series of risk events on the horizon, it’s likely to imagine that continued volatility will remain at play.
For the bullish side of the pair, the near-term strength seen in the first day of Q3 trade will be key, looking for buyers to continue pushing from this very key spot of support. Should buyers retain control, the next major area of resistance would be the same that turned around the March advance, running from 1.1448-1.5000.
On the bearish side of the matter, and given recent stimuli, it appears that some risk aversion may be in order. This could entail a push back towards the 1.1000 handle, and should price action hold resistance around that confluent spot of 1.1292, then the potential for a descending triangle break may remain in the cards. The descending triangle will often be approached with the aim of bearish breakouts, looking for the same motivation that’s brought in bears at lower highs to, eventually, take over to allow for a break through horizontal support. This is one of the many chart formations that are investigated in the DailyFX Education course. The stakes may seem raised here given the nature of this bigger picture support that remains in play.
Retail Traders Betting on Bears, but Can That Continue?
From an IGCS point of view, retail traders are currently heavily short in the pair, with 63% of traders currently holding bearish positions (as of this writing).
| Change in | Longs | Shorts | OI |
| Daily | -1% | -4% | -3% |
| Weekly | 4% | -10% | -5% |
--- Written by James Stanley, Strategist for DailyFX.com
Contact and follow James on Twitter: @JStanleyFX


