


Japanese Yen, VIX, AUD/JPY, Covid-19, Risk Aversion – Talking Points
- JPY continues to benefit from risk aversion, as trade tensions and climbing coronavirus cases sour market sentiment
- Elevated volatility may fuel the appreciation of the haven-associated Japanese Yen
- AUD/JPY consolidating in Descending Triangle after trend break. Is a downside move on the cards?
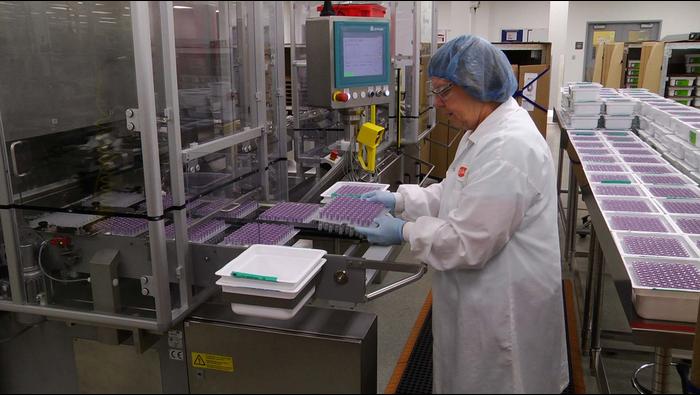
Haven demand has fuelled the recent strength in the Japanese Yen as coronavirus cases continue to climb, and trade tensions escalate.
Withcases of Covid-19 surpassing 10 million and a staggering 500,000 deaths recorded globally, the pandemic is re-exerting itself as a dampener on the so-called ‘V-shaped’ recovery.

Source – John Hopkins University (JHU)
The situation in the United States is becoming increasingly concerning, with local cases accounting for 25% of the global outbreak and several states delaying the easing of lockdown restrictions.
The delay in successfully supressing the outbreak in the world’s largest economy has shaken market sentiment as the potential for a ‘second-hit’ scenario, described by the Organisation for Economic Co-operation and Development (OECD), becomes increasingly more likely.
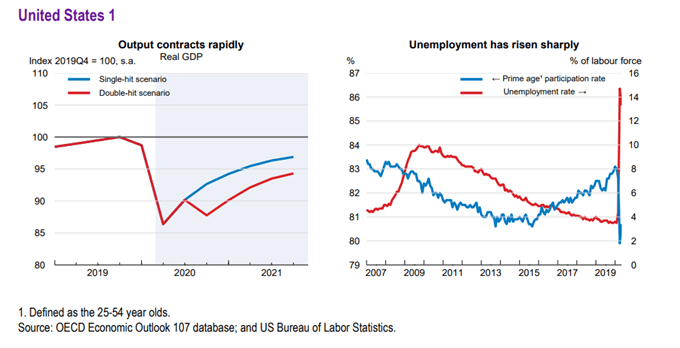
Source – Organisation for Economic Co-Operation and Development (OECD)
Moreover, tensions between the United States and its major trading partners has compounded the risk aversion seen since the start of the month as the possibility of an imposition of $3.1 billion of tariffs on EU imports is more than likely to result in retaliatory escalation.
Looking ahead, rising uncertainty amidst a weakening fundamental backdrop may continue to fuel volatility, and in turn, favouring the performance of the haven-associated Japanese Yen.
JPY Index vs Volatility Index (VIX) Daily Chart
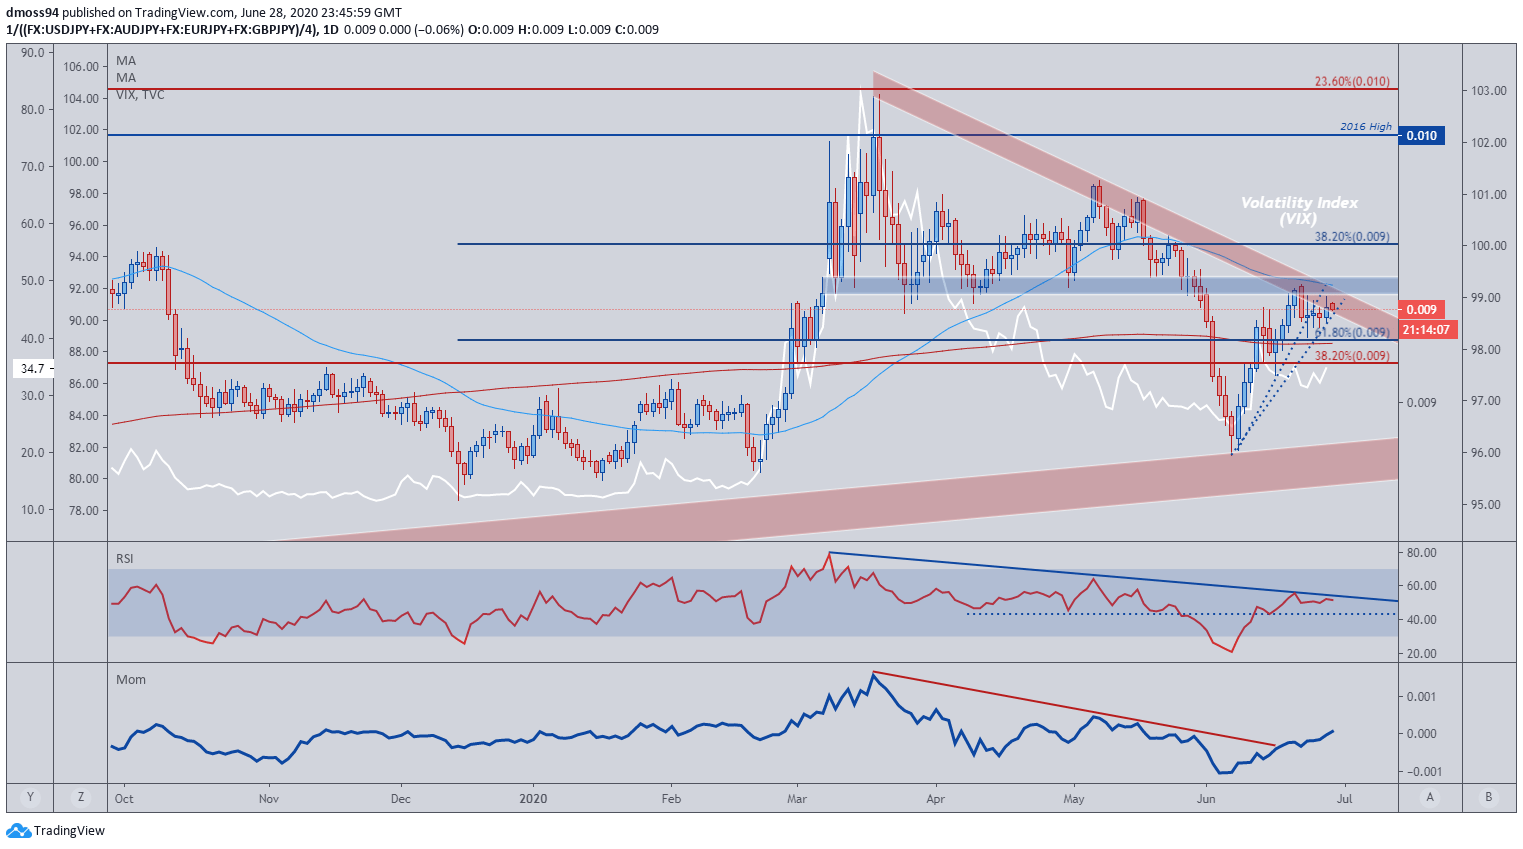
Source - TradingView
A resurgence of volatility has driven the rally seen in the haven-associated Japanese Yen, with the Yen index recovering from its lowest levels since March to test trend resistance extending from the yearly highs.
Prior price behaviour at this key inflection point suggests that the Yen may retrace the ground gained against its major counterparts, with the RSI reinforcing downside bias as the indicator remains confined by its 12-week downtrend.
However, the development in the momentum indicator provides a hint of topside potential as it continues to strengthen into positive territory.
A break and close above the previous gap-zone (highlighted in blue) could lead to further JPY strength, provided the RSI snaps through trend resistance.
With that being said, retracement towards the 200-day moving average and 61.8% Fibonacci remains the more probable scenario.
AUD/JPY Daily Chart – Descending Triangle Taking Place at Key Resistance
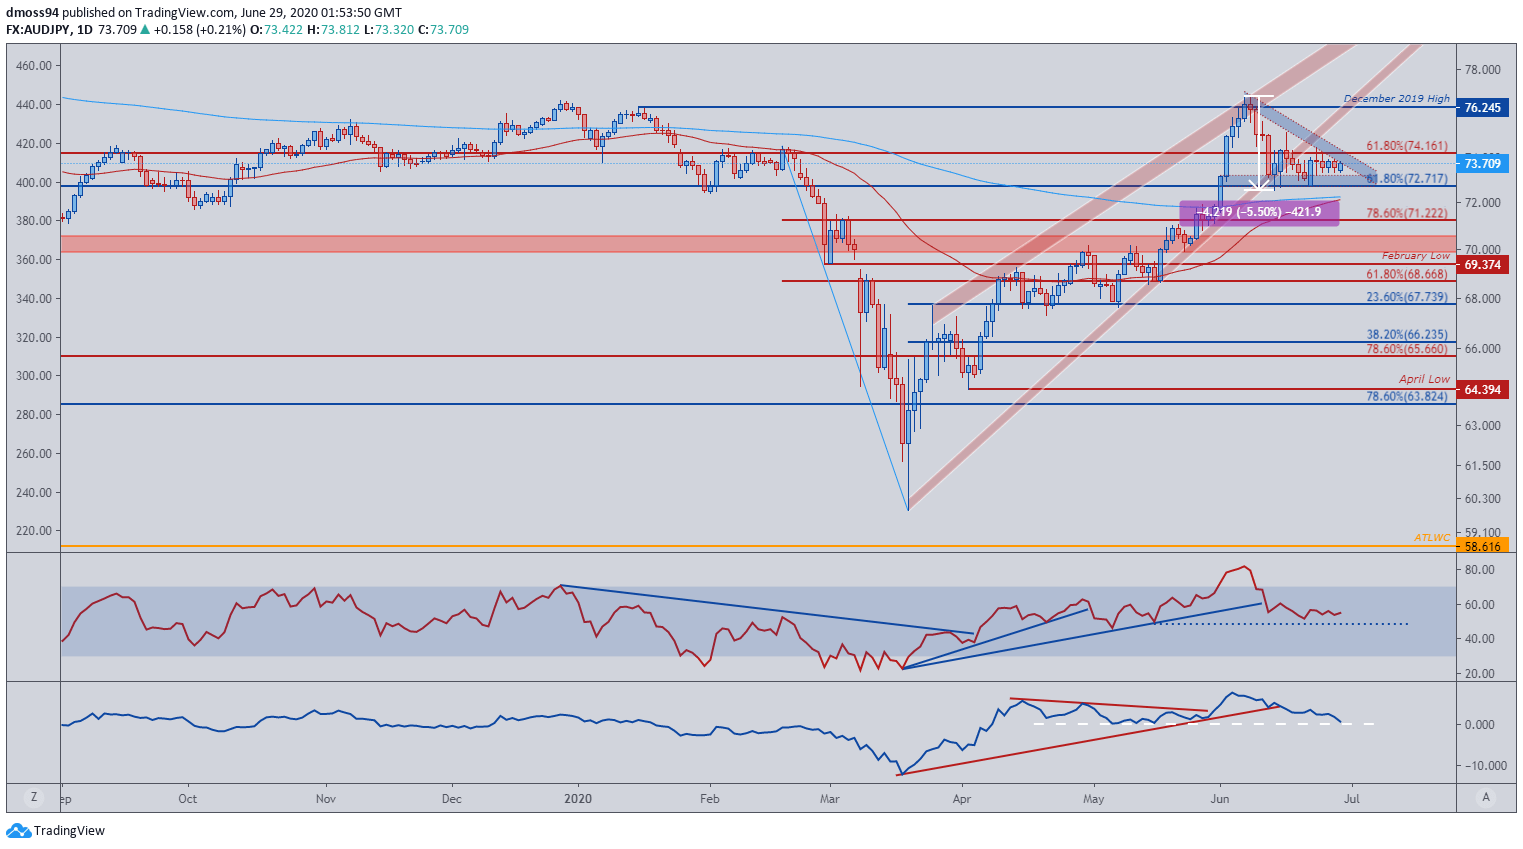
Source - TradingView
AUD/JPY continues to be a proxy for broad market sentiment, with the exchange rate pulling back as much as 5% from the yearly high set on June 8 (76.78).
The break through Rising Wedge support pushed AUD/JPY back to the 61.8% Fibonacci (72.72), leading price to consolidate within a possible Descending Triangle formation.
With price remaining capped by resistance at the 61.8% Fibonacci (74.16), a breakthrough triangle support and the 200-day moving average (72.27) could see AUD/JPY selling pressure intensify.
The momentum indicator suggests a downside break is the more likely outcome as it descends into negative territory.
However, the RSI remains indecisive as it flounders above 50, suggesting price may continue to consolidate between the two 61.8% Fibonacci levels (74.16 & 72.72) going into July.
| Change in | Longs | Shorts | OI |
| Daily | 0% | 11% | 5% |
| Weekly | 29% | -25% | -3% |
-- Written by Daniel Moss
Follow me on Twitter @DanielGMoss


