


AUD/USD Price Outlook:
- AUD/USD trades narrowly beneath 0.67 after surging higher since its mid-March lows
- Nevertheless, the Australian Dollar remains highly sensitive to risk sentiment
- As a consequence, AUD/USD may loosely track the performance of leading risk assets like the Nasdaq and S&P 500
Australian Dollar Forecast: AUD/USD Price Stalls Near 2020 Peak
The Australian Dollar has charged higher in recent weeks and has returned to the levels it began 2020 with as a result. While remarkable, the recovery has not been without its speedbumps both fundamentally and technically. A burgeoning Australia-China trade conflict and continued economic uncertainty due to coronavirus are two of the main factors that have worked to erode the Australian Dollar’s recovery, but US Dollar weakness has seemingly prevailed as volatility recedes and the Fed expands its balance sheet.
AUD/USD Price Chart: 4 – Hour Time Frame (January 2020 – June 2020) S&P 500 Overlaid in Blue
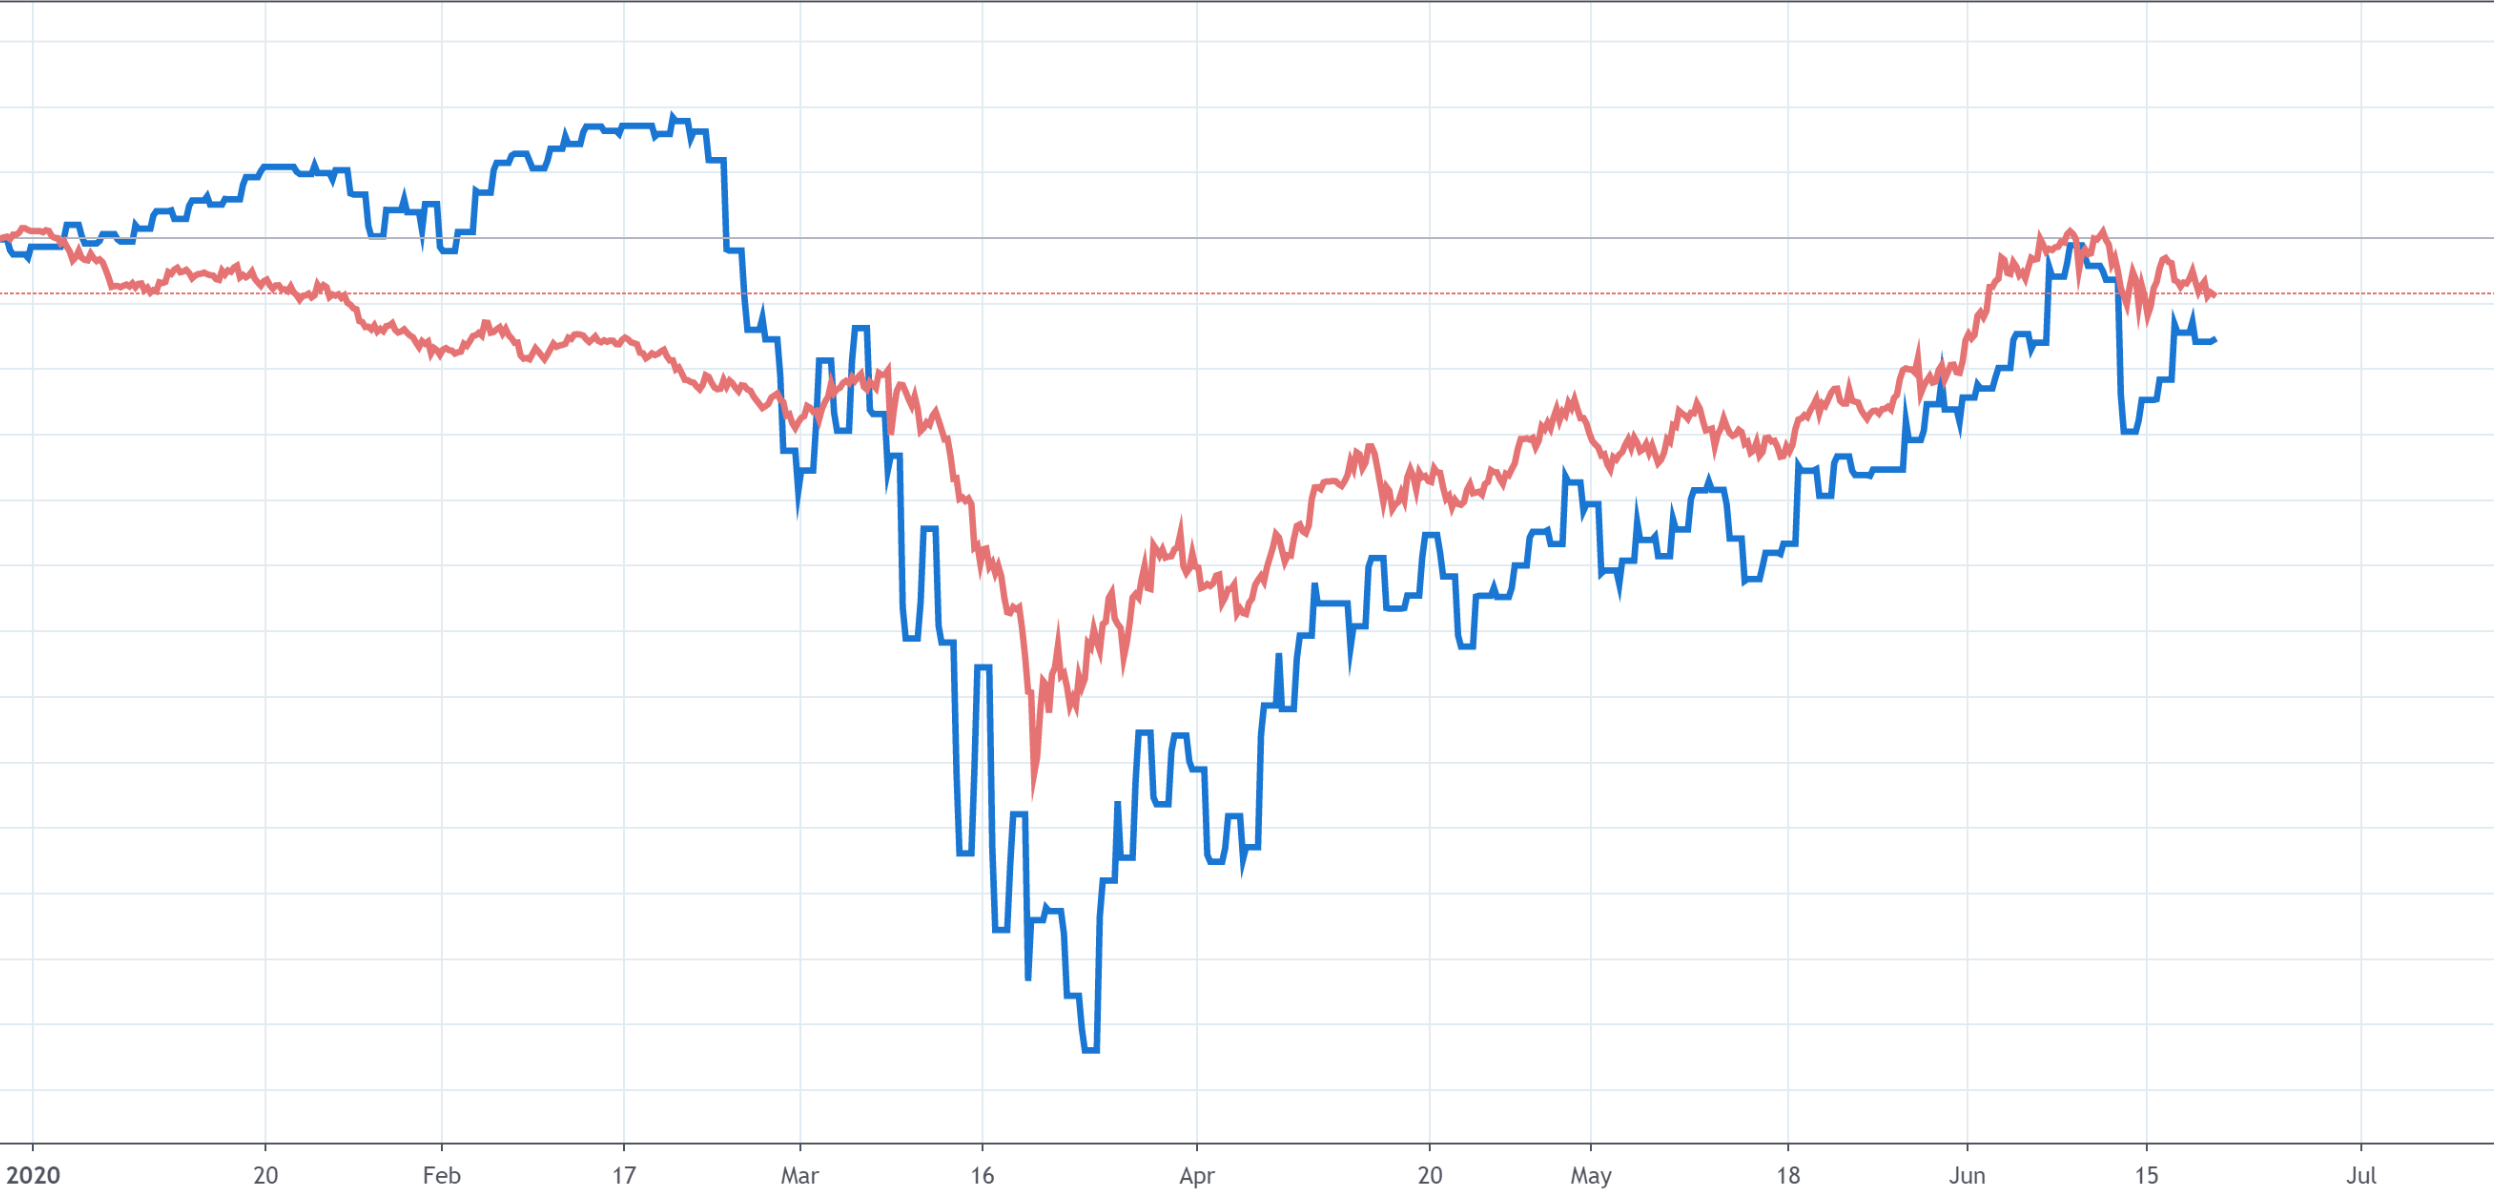
Chart created with TradingView
Now that AUD/USD has returned to the levels it was trading at prior to the covid outbreak, market participants must decide if the current landscape constitutes a continuation higher, or if the recovery has become overbought and a retracement is in store. Either way, it would appear the shorter-term performance of the Australian Dollar is closely tied to broader risk sentiment as it has declined alongside recent pullbacks in the Nasdaq 100 and S&P 500.
AUD/USD Price Chart: 4 – Hour Time Frame (January 2020 – June 2020)

Therefore, resurgent selling pressure in the US indices may lead to broader risk aversion that might leave AUD/USD vulnerable. While traders and investors grasp for the longer-term trend, the Australian Dollar may be caught between resistance overhead, derived from the recent peak and near 0.70, and support beneath, around 0.6685.
| Change in | Longs | Shorts | OI |
| Daily | -11% | 15% | -3% |
| Weekly | -27% | 109% | -3% |
In between exists an ascending trendline from the March 19 low, but recent price action suggests it has lost some influence and may act as a minor technical level going forward. Therefore, it may be prudent to keep an eye on developing fundamental themes and event risk as AUD/USD awaits a longer-term trend. If either of the highlighted areas are pierced, it may suggest a continuation in that same direction is ahead. As it stands, IG Client Sentiment data suggests that direction may be lower.
--Written by Peter Hanks, Analyst for DailyFX.com
Contact and follow Peter on Twitter @PeterHanksFX


