GBP price, news and analysis:
- GBP/USD has lost some of its recent gains ahead of UK GDP data due Friday that will show a dramatic fall because of the coronavirus pandemic.
- As London stock prices fall and two-year Gilt yields drop to a record low, the near-term outlook for GBP/USD is poor on “risk off” sentiment after gloomy predictions by the US Federal Reserve.
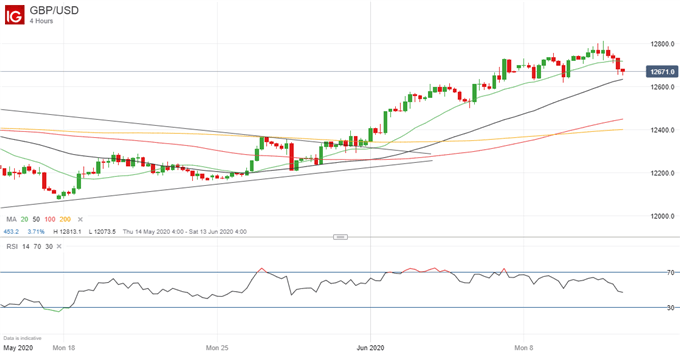
- Technically, the pair has dropped back below resistance at the 200-day moving average but is no longer overbought.
GBP/USD sliding lower
GBP/USD is weak ahead of UK GDP data due at 0700 local time Friday that are expected to show a dramatic contraction in the economy due to coronavirus lockdowns. Economists polled by the Reuters news agency are predicting, on average, a decline in GDP in April of 10% three-months/three-months. However, that hides an enormous range of between the most optimistic forecast of -2.4% and the most pessimistic of -35%.
Where the decline falls between those two extremes will likely determine the next near-term move in GBP/USD. However, the background is poor after downbeat projections Wednesday from the US Federal Reserve and concerns about a possible second wave of Covid-19 infections.
These factors have knocked back stock prices, with the FTSE-100 index of leading London-listed stocks down by more than 2% in early trading Thursday and the yield on the two-year UK government bond falling to a record low of minus 0.102% amidst a widespread move away from assets seen as inherently risky.
GBP/USD Price Chart, Four-Hour Timeframe (May 14 – June 11, 2020)

Chart by IG (You can click on it for a larger image)
| Change in | Longs | Shorts | OI |
| Daily | 3% | -7% | -3% |
| Weekly | 4% | -10% | -5% |
Meanwhile, from a technical perspective, GBP/USD has dropped back below the 200-day moving average that has acted as resistance for the past week. In the process, that has unwound an overbought reading from the relative strength index, which has fallen to just above 66 – under the 70 level that implies an overbought asset.
You can find a beginner’s guide to the basics of technical analysis, and how it can be used to trade forex, here.


We look at currencies regularly in the DailyFX Trading Global Markets Decoded podcasts that you can find here on Apple or wherever you go for your podcasts
--- Written by Martin Essex, Analyst and Editor
Feel free to contact me via the comments section below


