


The Dow Jones crossed the 2016 trend-line in recent sessions which helps bolster its outlook, with the 200-day MA at 26295 up next as resistance. There are a couple of gap-fills in the vicinity of the 200 as well to watch up to just over 27k. While there is resistance in the area thus far the price action has been constructive and suggests we could continue to see higher levels.

Dow Jones Daily Chart (between levels, price action solid)
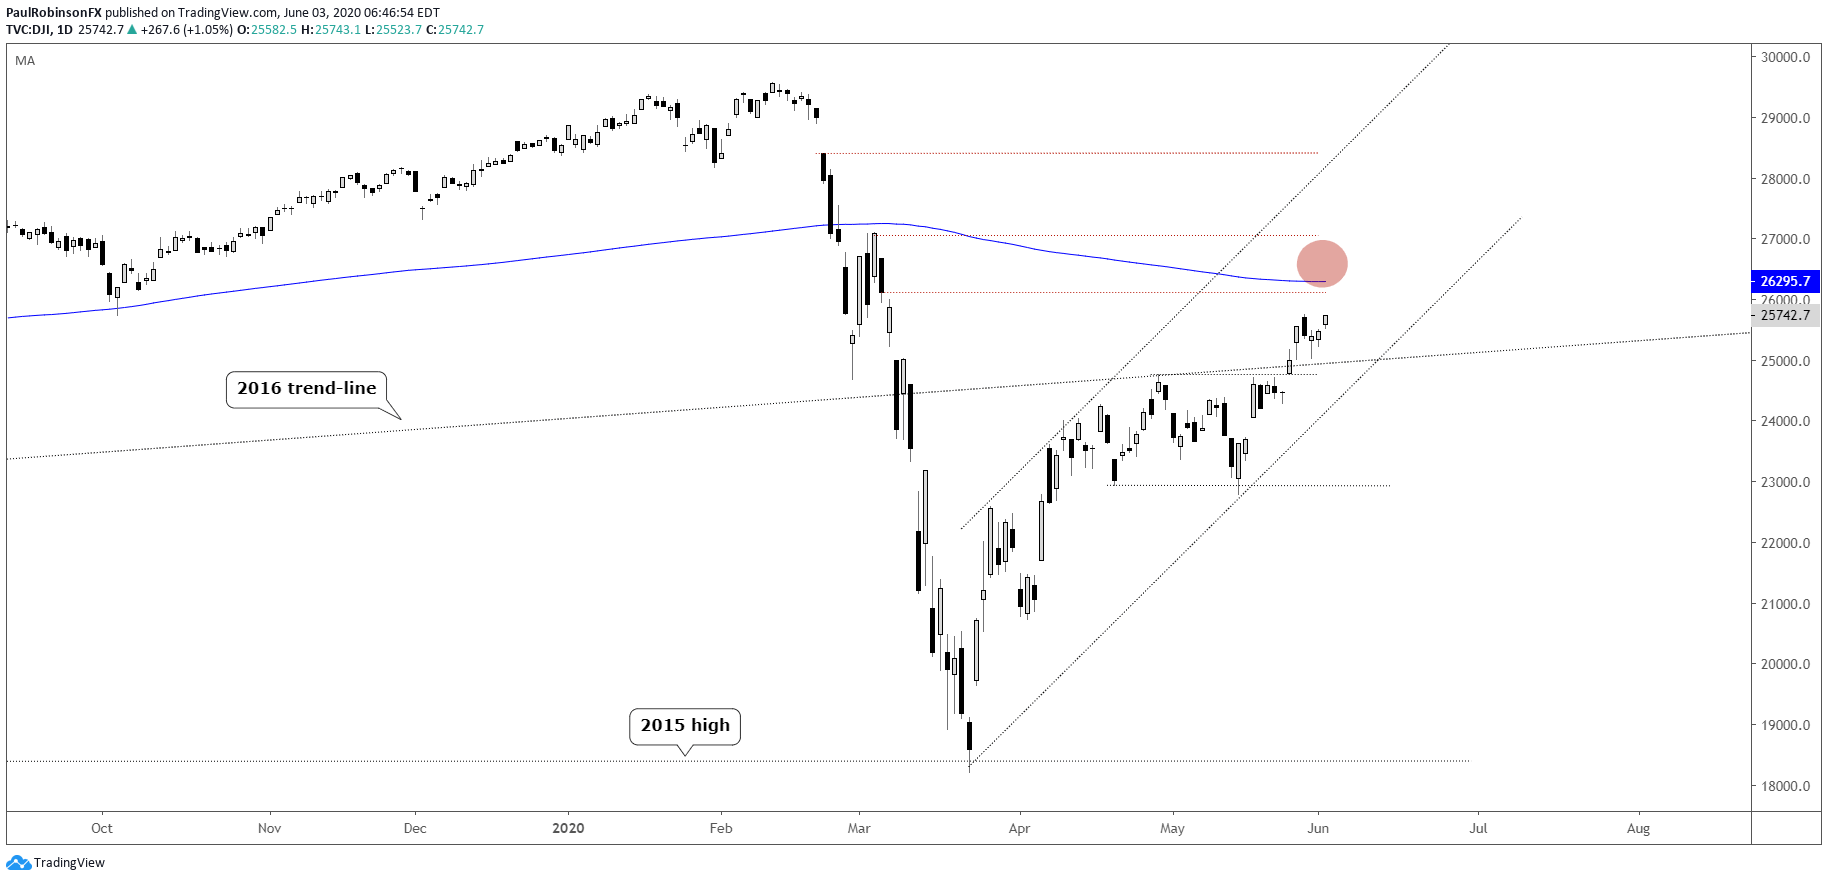
Dow Jones Chart by TradingView
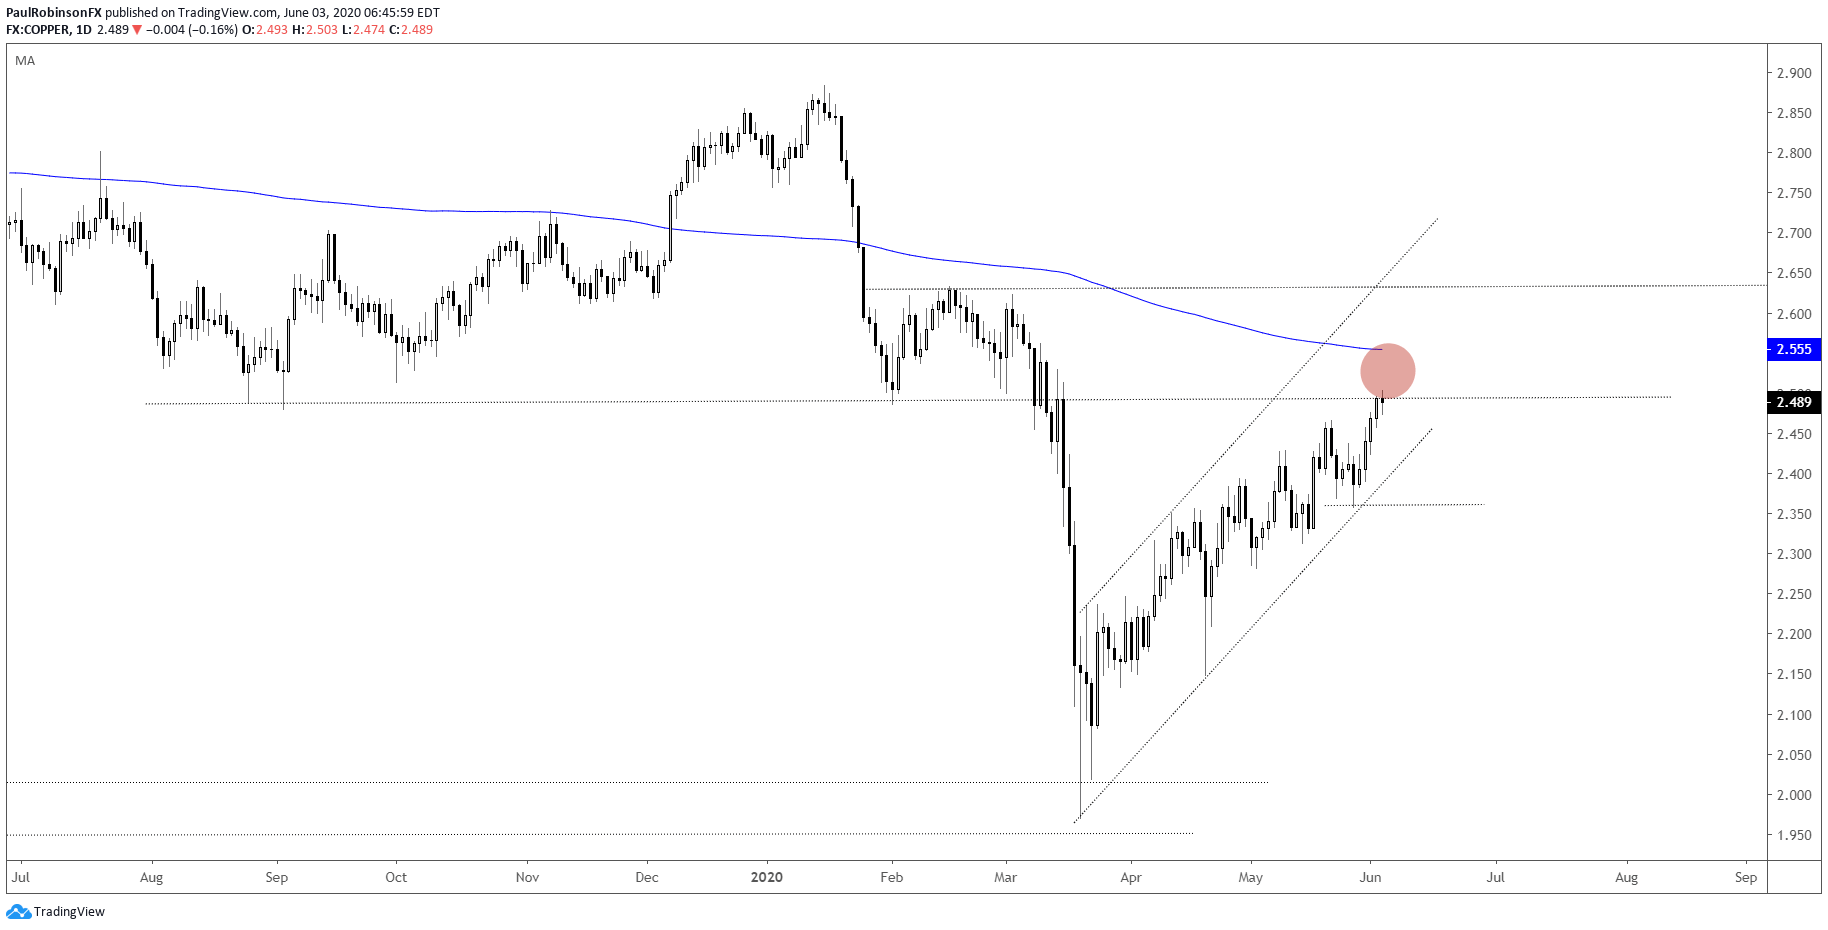
Copper has seen it recover much of the down-move inflicted since the coronavirus struck, which now has it at an important crossroad. Around the 2.50 level we have resistance from late-summer/February that could either put another dent in the ‘3-step forward/2-step back’ rally, or be the pressure point that breaks and allows momentum to pick up.
Recent history suggests we will see a pullback, but again this is one of those spots where a break in that sequence could develop. If that is the case, then the 200-day at 2.55 and 2.63 level will be targeted. If a pullback develops then as long as copper stays within the confines of the channel off the March low, the upward trajectory will remain intact and keep price pointed north. A break of the channel will be required to turn the outlook negative.
Copper Daily Chart (at an important spot)
To see all the charts we looked at, check out the video above…
Resources for Index & Commodity Traders
Whether you are a new or an experienced trader, DailyFX has several resources available to help you; indicator for tracking trader sentiment, quarterly trading forecasts, analytical and educational webinars held daily, and trading guides to help you improve trading performance.
We also have a series of guides for those looking to trade specific markets, such as the S&P 500, Dow, DAX, gold, silver, crude oil, and copper.
---Written by Paul Robinson, Market Analyst
You can follow Paul on Twitter at @PaulRobinsonFX


