GBP price, news and analysis:
- The UK Debt Management Office is planning to raise £180 billion by selling government debt between May and July to counter the economic impact of the coronavirus pandemic.
- The DMO’s announcement followed news that UK public sector net borrowing in March was higher than expected.
- The figures have worsened the outlook for GBP as global market sentiment remains fragile.
GBP/USD outlook darkens
The prospects for GBP/USD and the GBP crosses have worsened after news that the UK Debt Management Office plans to issue £180 billion of government debt between May and July to finance the UK government’s spending to offset the impact of the coronavirus pandemic on the UK economy. Previously, the DMO had planned to sell £156.1 billion of bonds in the whole year from April 2020 to March 2021.
The news came after data showing that UK public sector net borrowing surged in March to £2.3 billion rather than the £2.0 billion expected by economists and up from the modest £0.1 billion recorded in February.
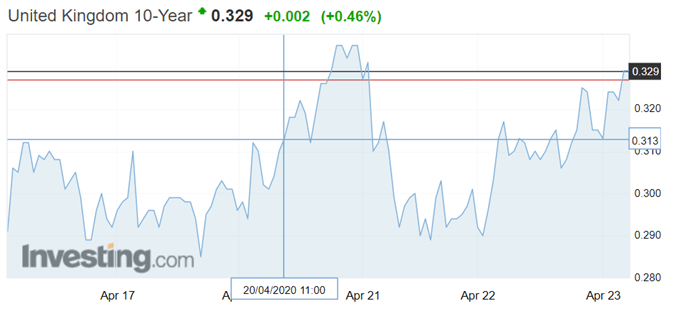
The figures had an immediate impact on the UK government bond market, where the recent advance in yields was extended.
UK 10-Year Government Bond Yield Chart, 30-Minute Timeframe (April 16 – 23, 2020)

Chart by Investing.com (You can click on it for a larger image)
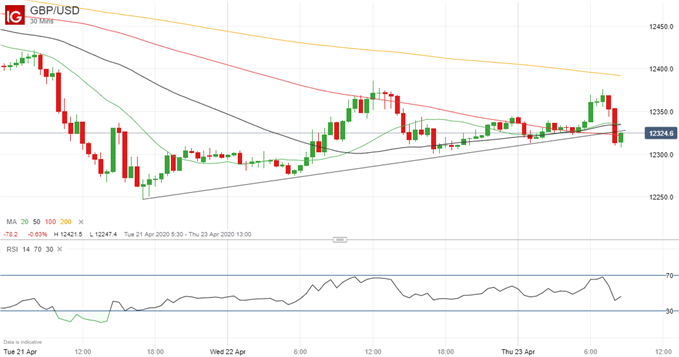
The latest figures also weakened GBP/USD, extending its decline against a firmer US Dollar that continues to benefit as a safe haven from coronavirus concerns.
GBP/USD Price Chart, 30-Minute Timeframe (April 21 – 23, 2020)

Chart by IG
| Change in | Longs | Shorts | OI |
| Daily | -10% | 2% | -5% |
| Weekly | -18% | 40% | 0% |
Meanwhile, there was also bad news for Sterling in the latest purchasing managers' indexes for the UK in April. The manufacturing, services and composite PMIs all dropped by more than expected, prompting IHS Markit, which compiles the figures, to forecast a quarter/quarter contraction in the UK economy of at least 7%..
How to Invest During a Recession: Investments & Strategy
We look at Sterling regularly in the DailyFX Trading Global Markets Decoded podcasts that you can find here on Apple or wherever you go for your podcasts
--- Written by Martin Essex, Analyst and Editor
Feel free to contact me via the comments section below


